Remote lab manual:
Laser Remote Sensing (LRS)
Continue to the experiment
At VU University in Amsterdam a powerful laser is available for a remote experiment to study photosynthesis. The data generated in the experiment can be downloaded for further analysis. The manual below explains how to conduct the experiment. In order to do so Microsoft Silverlight should be installed as an extension of your Internet browser. Silverlight can be downloaded from http://www.microsoft.com/silverlight/.

Note: Preferably use Firefox (PC/Mac) or Safari (Mac) as a browser. The experiment can also be conducted using Internet Explorer but in that case manual updating of camera images will be required. Google Chrome (from version 42.0) and Edge do not (fully) support Silverlight and can thus not be used.

Figure 2 shows a schematic of the experimental setup. The laser emits a monochromatic beam of light at a wavelength of 488 nm. The beam first passes a shutter, which you can open or close. That provides you with the tool to switch the measurement on/off (when the shutter is closed you will still measure some background noise). Next the beam passes through a gray density filter, which you can use to control the light intensity leaves are exposed to. Two lenses (L1 and L2) and two mirrors (M1 and M2) direct the laser beam to the leaf of the plant.
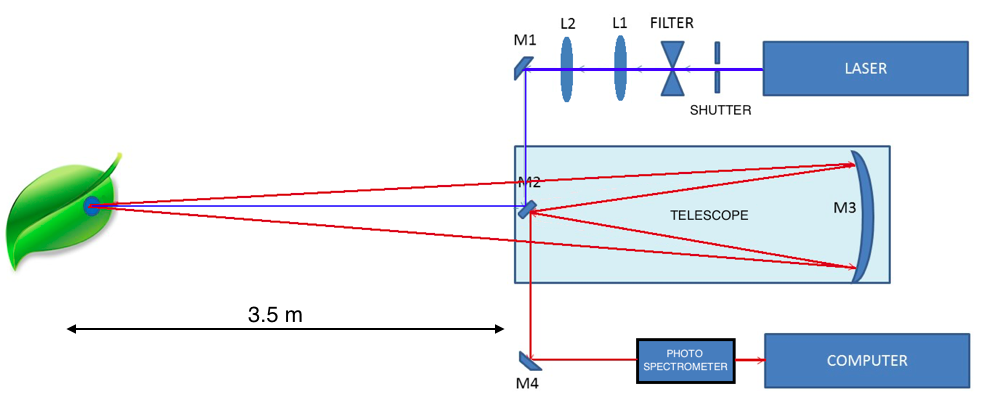
The reflected light (fluorescence) is collected using a telescope and hits the curved mirror M3. Through mirrors M2 and M4 light is directed to a photo spectrometer, which is interfaced with a computer. Through Internet this computer directly sends the results of the measurement to your computer.

Q9: Do the mirrors and lenses in the setup have an effect on the wavelength of the light that hits the leaf? If not, what is their effect?
Making a reservation for the Laser Remote Sensing experiment

The remote lab can be reached at: http://few.vu.nl/lrs

You will obtain the screen shown in figure 3 (if not, or in case you get the message that the experiment is offline, please send an e-mail to Jan Mulder (j.m.mulder@vu.nl).
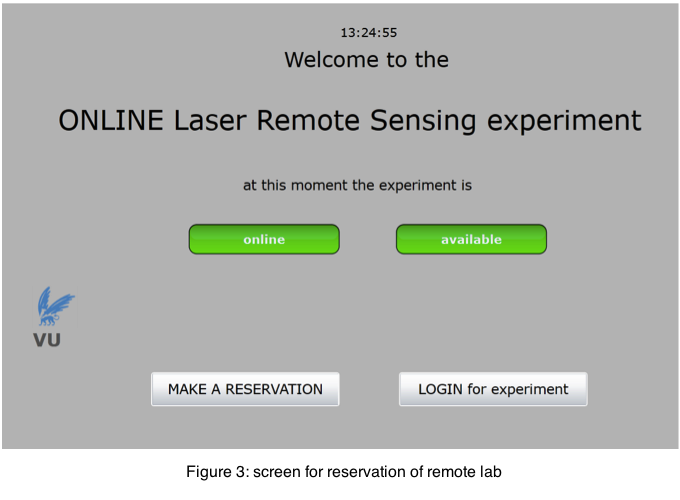
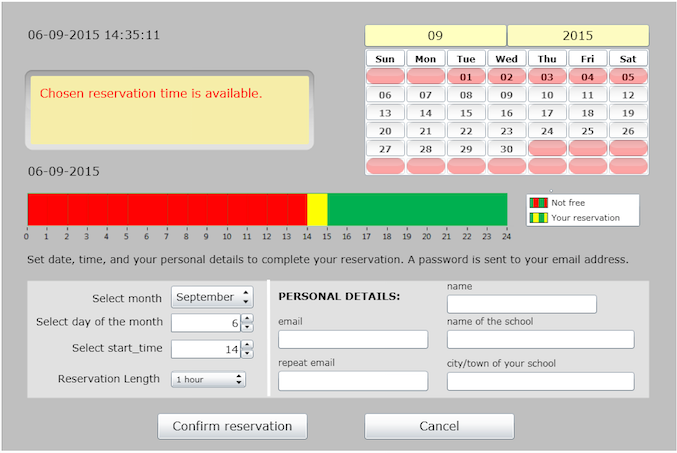
Before you login to conduct the experiment you first need to make a reservation. This is to ensure that only one user can run the experiment at the time. Click on MAKE A RESERVATION to plan your reservation. The screen in figure 4 will be shown:
At the left bottom of the window select a month and day to schedule your experiment. A reservation always lasts for 1 hour. You can log in for the start of the hour that you reserve. The bar at the center of the screen shows available time slots for the day you selected. The experiment can be reserved 24 hours a day but please do take into account that plants respond different at night as compared to daytime. On the other hand, it may also be interesting to examine the differences!

Please fill out the remaining parts. Make sure to enter a valid e-mail address. After completing the data you will receive an e-mail at the given address with the timeslot and password to conduct the experiment.

Start the experiment

On the scheduled day and time log in to conduct the experiment through http://few.vu.nl/lrs.
Click on 
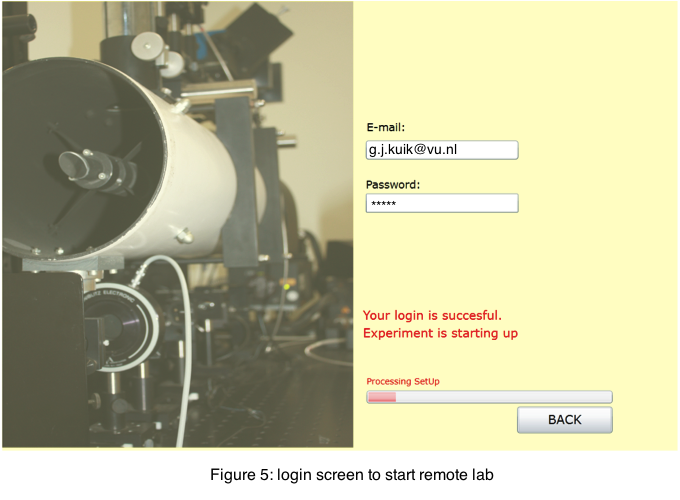
LOGIN for experiment, which results in the screen shown in figure 5.
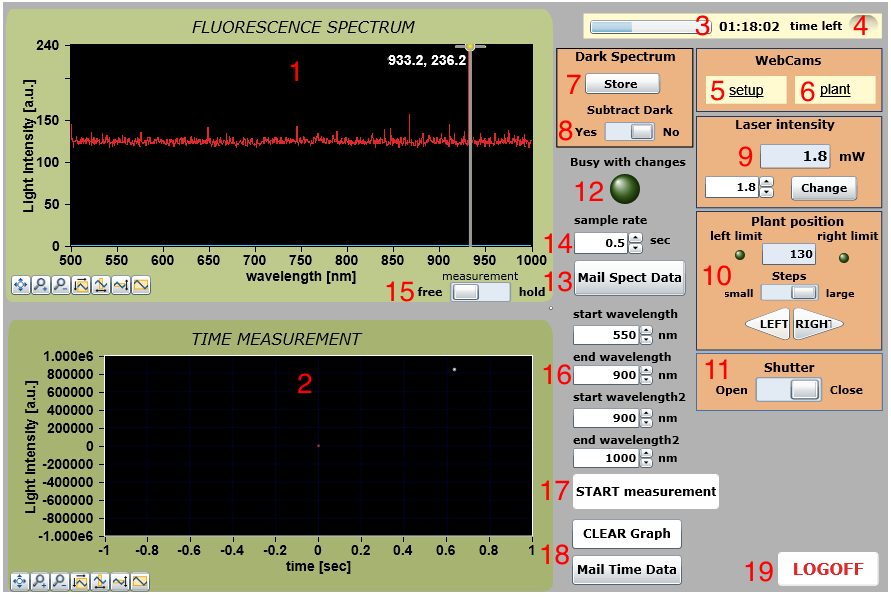
Enter your e-mail address and password. The system will start up. This takes about a minute. The control panel shown below in figure 6 will appear:
Figure 2: The LRS setup. Note that the plant under investigation is located a few meters away from the experimental setup. Hence, we talks about remote sensing. For details see text.
Figure 4: screen for time reservation
Figure 6: the LRS web interface. For details see text.
  1. This graph shows the fluorescence spectrum of the leaf. As the shutter is closed the chlorophylls in the leaf do not fluoresce so what is visible is background noise, also called the dark spectrum (see (7) and (8)). Vertical cursors are available in the graph and can be dragged using your mouse allowing accurate determination of wavelengths of peaks.
  2. This graph shows the total fluorescence light intensity over time for two selected wavelength regions (see (15)) after starting the measurement (see (16)). Also in this graph vertical cursors are available to select time regions.
  3. The timer shows how much longer you can experiment. From the moment your reservation starts you get 55 minutes to conduct the experiment.
  4. A light signal will be given when only 5 minutes are left. This means you need to wrap up your experiment.
  5. A link, which pops up a new tab window that shows the image of a webcam directed on the experimental setup. If you keep the shift key pressed the image will be shown in a new browser window (handy!).
  6. A link, which pops up a new tab window that show the image of a webcam directed on the leaf of the plant under investigation. If you keep the shift key pressed the image will be shown in a new browser window (handy!).
  7. When you click on this button the dark spectrum will be stored in memory.
  8. After you have stored the dark spectrum you can set the slide to Yes to subtract the dark spectrum from the fluorescence spectrum.
  9. The laser intensity can be adjusted here. On the left you set the desired intensity. Only after you click on Change the intensity will be adjusted. The indicator on top shows actual the laser intensity.
  10. These buttons can be used to adjust the position of the leaf of the plant (the plant is positioned on a movable platform). Coarse and fine adjustments can be made. The webcam image of the leaf of the plant (see (6)) can be used to monitor the laser spot on the leaf.
  11. This switch opens and closes the shutter, which in effect starts and ends a continuous fluorescence measurement (shown in graph 1).
  12. When Busy with changes lights up adjustments in the setup are made. You cannot make any adjustments until the light is off.
  13. When you click this button the fluorescence spectrum shown in graph 1 will be e-mailed to the e-mail address you used to reserve the experiment.
  14. When you take time measurements the sample time reflects how often per second samples are collected from the fluorescence spectrum.
  15. You can freeze the graph displayed on screen (in the background the measurement continues). Convenient e.g. when you want to read out cursor values.
  16. Here you can set values for two wavelength ranges (in nm) can be monitored over time for time measurements.
  17. Click on this button to start a time measurement. The button will change into STOP measurement once you start a time measurement.
  18. Only after taking a time measurement these buttons will appear. CLEAR graph can be used to remove the last time measurement recording. Mail Time Data may be used to e-mail the time data measurement to yourself.
  19. Click here to log off to end the experiment. The data taken last (fluorescence spectrum and if applicable time measurement) will automatically be e-mailed to yourself.