Remote lab:
Laser Remote Sensing (LRS)
Activate the webcam directed on the leaf of the plant and open the shutter. Check where the laser beam hits the leaf and also check whether graph 1 changes from background noise to a real fluorescence spectrum.
Play around a little with the positioning of the plant leaf. When the laser beam hits a good spot take a fluorescence spectrum, you can continue with a measurement.
Close the shutter and take a dark spectrum. Subtract the dark spectrum from the fluorescence spectra you will record. Take a good measurement of a fluorescence spectrum, mail the data to yourself and close the shutter.
The e-mail you will receive contains an attachment, which is a text file containing all data. The first column contains the wavelengths of the fluorescence spectrum measured, the second column showed the relative intensities of the fluorescence (in arbitrary units). Open the text file using Notepad (Windows) or TextEdit (Mac), copy the data and paste it in Microsoft Excel, OpenOffice Calc or Numbers. Make a fluorescence graph (wavelength along the x-axis, relative fluorescence intensities on the y-axis).
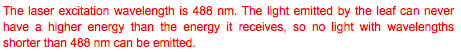
Q10: Which wavelengths of light the leaf cannot emit for sure?
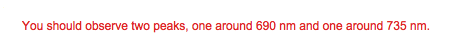
Q11: Which wavelengths of light do you measure?
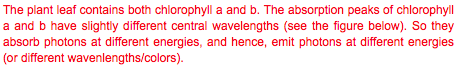
Q12: In the fluorescence spectrum why do you see two peaks only?
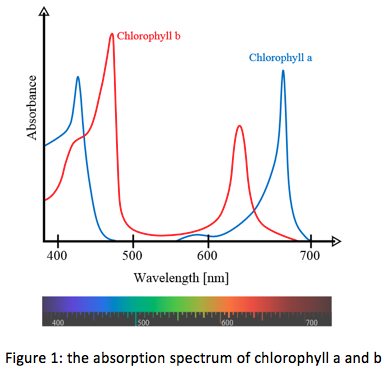
Q13: In figure 1 below the absorption spectrum of chlorophyll a and b is shown. Which one absorbs best at 488 nm?
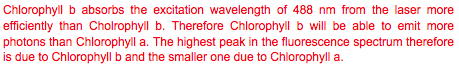
Q14: Can you argue which fluorescence peak is due to Chlorophyll a and b?
Time measurement
It is also possible to measure the total fluorescence for two wavelength regions simultaneously as a function of time. This is what you will do next. You can select the wavelength regions yourself. Make sure that one of the center wavelengths of fluorescence is included in each region chosen. When you perfom a measurement first close the shutter, then start the time measurement and open the shutter after a few seconds. Then the first few seconds show the baseline, followed by the total fluorescence for the two selected wavelength regions. You can study how the total fluorescence changes over time with regard to the baseline.
Start up a time measurement, and while it is running answer the question below.
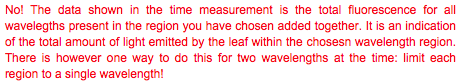
Q15: From the time mesurement data, is it possible to determine the wavelengths of the fluorescence light emitted?
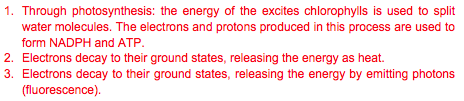
Q16: In the introduction we discussed that a plant can release energy it obtained from light absorption in three different ways. What are they?
After running the measurement for a few minutes you will see that the data traces in the time measurement run nearly horizontal. If that is the case you can end the measurement. Click on Mail Time Data to collect the experimental data. As you did for the fluorescence spectrum, prepare a plot of the time measurement. If you want to repeat a time measurement do not forget to clear the graph before you start a new measurement.
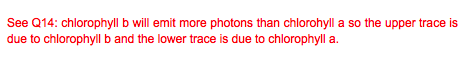
Q17: Which of the two traces belongs to chlorophyll a and b?
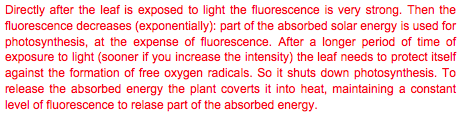
Q18: Can you explain the shape of the time measurement traces? Hint: after a long time, what happens to the energy absorpbed by the leaf?
Conduct your own research on photosynthesis
Try to come up with ideas to conduct some experiments to get a better understanding of photosynthesis (e.g. you can play with the intensity of the light, study how fast a plant recovers, investigate differences between day and night, etcetera). Before you conduct your measurements, (1) define your research question, (2) describe how you can experimentally determine what the answer would be, (3) present expected outcomes for possible senarios. Then conduct the experiment, analyse and discuss your results and present your conclusion.
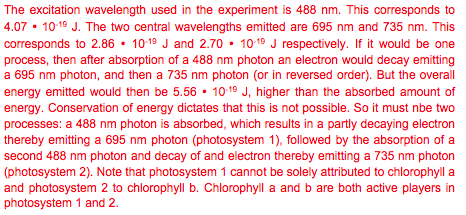
Q19: At the introduction the following was mentioned about photosynthesis: "Chlorophyll contains clusters of proteins that can absorb light and extract energy from it. Plants and algea have two separate protein complexes that together complete the light reactions, called photosystem 1 and photosystem 2". Can you proof that this must be the case? Hint: look at the photon energies.