Instrumentation characteristics
In this section two series of measurement are presented. The first measurement involves a calibration and the second is a profile measurement. The experiment was set up according to fig. 2.1 as discussed in system design. The relevant characteristics of the instrumentation used is given in table 4.1.
Calibration measurement
The first series of measurements concerns the calibration. The objective is to compare the measurements performed with the LDA system with another independent measurement system, in this case the flow meter. The Doppler frequency of the light originating from the measurement volume positioned at the axis of the flow tube is measured for various volumetric throughputs. These data can be used to calculate the flow velocity at the axis (see eq. (1.3)) and thus to calculate the volumetric throughput (see eq. (1.15)).
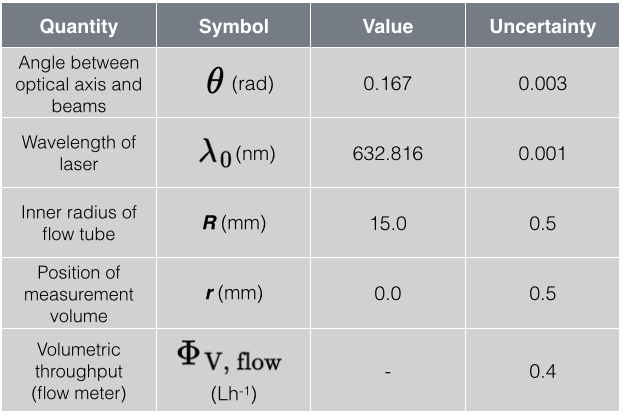
The first step in performing a series of measurements is to optimize the system. This has been discussed in the previous section. Furthermore one will have to estimate the values of the relevant variables and their respective uncertainties. All parameters and variables that play a role in the eqs. (1.3) and (1.15) are relevant and their values and uncertainties have been tabulated in table 4.2. Here one should realise that the uncertainty of the angle theta follows from the estimated uncertainties in the distance between the two beams passing lens L1 and the back focal lenght of this lens.
Profile Measurement
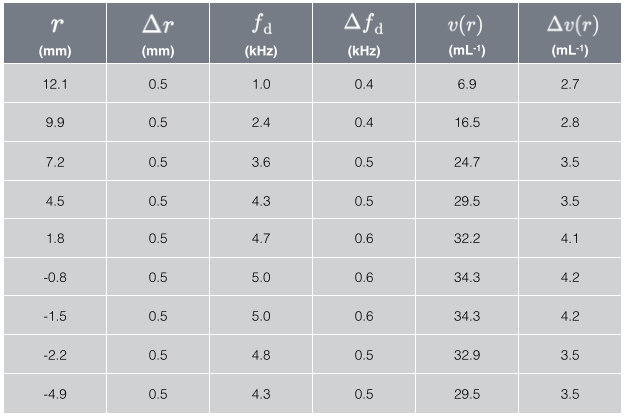
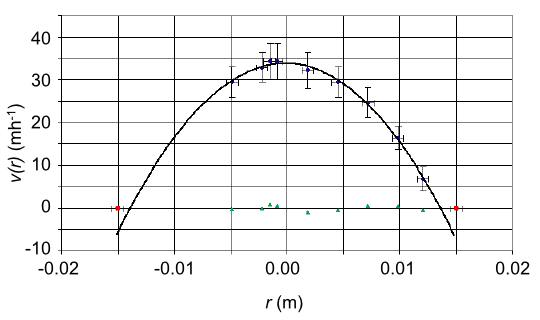
The second series of measurements involve a velocity profile measurement. If the Doppler frequency of the light originating from the measurement volume at various positions in the flow pipe is measured a velocity distribution in the flow pipe can be established through use of eq. (1.3). Again first the LDA system should be optimized as discussed before and the values of the relevant variables and their respective uncertainties for this measurement are also presented in table 4.3. All parameters and variables that play a role in eq. (1.3) are relevant and the value and uncertainty of tube radius R are relevant to the estimation of position r of the measurement volume and its uncertainty. The measurements and the corresponding velocities are presented in table 4.5. In fig. 4.2 the velocity profile is presented graphically. The walls of the flow tube have been indicated in red.
Table 4.1 : The instrumentation used in the LDA system and its characteristics
Table 4.2 : The relevant parameters and variables for a calibration/profile measurement, with their respective uncertainties. The volumetric throughput is measured in litres per hour.
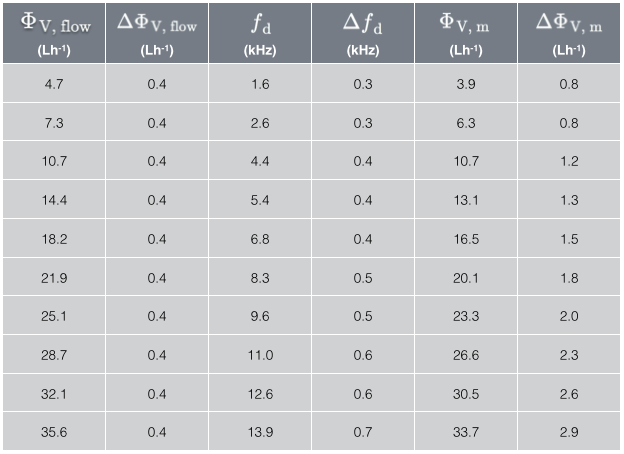
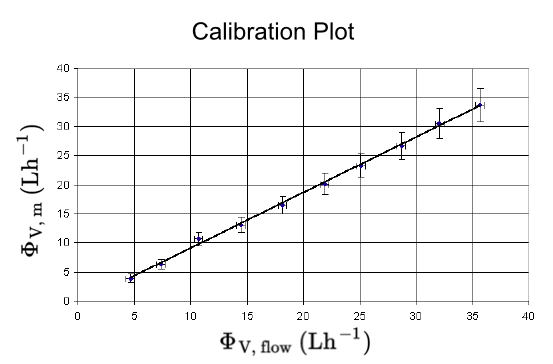
When the system is optimized and the parameters and their uncertainties are known, the measurements can be performed. A series of measurements was performed for increasing volumetric throughputs, and the results are presented in table 4.3. The first two columns show the increasing volumetric throughput and its uncertainty measured by the flow meter. The third and forth columns show the measured Doppler frequencies and the corresponding uncertainties. The last two columns show the volumetric throughputs with corresponding uncertainties, based on the Doppler frequencies. A plot of these data is presented in fig. 4.1.
Table 4.3 : The measured Doppler frequencies and the corresponding calculated volumetric throughput in litres per hour.
Figure 4.1: The volumetric throughput based on the measurement of the Doppler frequencies for different flow velocities plotted with respect to the volumetric throughput based on the flow meter measurements. The throughput is given in litres per hour.
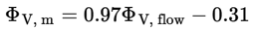
Furthermore the data have been fitted and the function that was found is given by:
It may be concluded that the two methods yield comparable results. It appears furthermore that the LDA measurements seem to underestimate the velocity of the flow, but it should be noted that the data are compared with the flow meter that might overestimate the velocities.
Table 4.5 : The measured Doppler frequencies and the corresponding calculated flow velocity for various positions in the tube.
Figure 4.2 : A profile of the velocity of flow in a cylindrical flow tube. The red dots indicate the inner radius of the tube and the green dots represent the residues.
The data in fig. 4.2 have been fitted and the resulting profile was found to be:
The data strongly support the theoretically derived parabolic velocity profile in a cylindrical horizontal tube. Note that it again appears as if the LDA method underestimates the velocity somewhat.