Spectroscopy, or the physics of the interaction between light and matter, with an emphasis
of the wavelength dependences, is a field of research that yields extremely accurate
information. This is because wavelength, or rather frequency, is the quantity that can be
measured most accurately. Spectroscopy was initially closely connected to the
development of optical instruments used for the dispersion of light into its wavelength
components. The prism and the grating were the instruments developed for this purpose.
Later the field of spectroscopy became closely connected to that of the laser.
Investigations of atomic spectra began in the 19th century with the work of
J. von Fraunhofer,
who measured and interpreted the spectrum of the sun. The lines, that have over the years been
studied in high precision (see
Table), originate from atoms (and ions) in the sun and from absorbers in the Earth's atmosphere.
Fraunhofer spectrum of the sun
Kirchhoff
explained the difference between
absorption and emission spectra. Moreover he showed that each observed spectrum was
characteristic for the chemical species that is interacting with the light. This made it
possible to identify new elements, such as cesium and
rubidium, based on spectroscopic
observations.
The element helium, for the Greek helios, or Sun, was first
discovered in 1868 in the spectra of solar flares,
using the techniques of Bunsen and Kirchhoff, before it was shown to exist on Earth,
also from its spectrum.
The characteristic
yellow resonance line
in helium is very close to the
doublet of sodium.
The Scottish chemist
William Ramsay heated the mineral cleveite, and found small traces of the element helium
much later in 1895.
As of today an enormous amount of spectroscopic work has been
performed, that is carefully listed for the scientific community in accesible databases.
Such databases exist for observed
line spectra in the form of tabulations of lines pertaining to
a certain element, but also to the charge state of the species.
The species are, e.g. for iron, identified as Fe I for the neutral iron atom,
Fe II for the singly ionized iron,
Fe III for the doubly ionized iron or Fe++, etc.
Such spectra were already collected in the 19th century, but since no
ordering principle was available at that time, they were like stamp collections.
Balmer
was the first to recognize a regularity in a series of lines of the hydrogen atom
as early as 1885. The visible lines could be fitted to the formula for the
Balmer series:
L = LA n2/(n2 - 4) for n>2
yielding a constant LA = 364.56 nm.
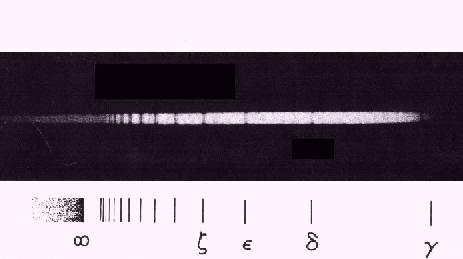
Balmer series observed in a hot A-type star
Later in 1890
Rydberg
generalized the series treatment by including other progressions of lines in
the hydrogen atom yielding the equation:
1/L = RH (1/n2 - 1/m2)
for integer n and m and the constant RH = 10972160 m-1,
which was named the
Rydberg constant.
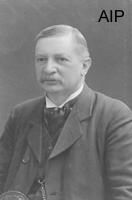 J. Rydberg
Balmer's series fits to n=2, while the predicted n=3 series
was observed by Paschen in 1908.
The latter was possible by opening up the infrared region of the
electromagnetic spectrum for spectroscopy.
At the other end, the domain of the vacuum ultraviolet
(at wavelengths shorter than 200 nm, where the atmosphere does not
transmit the light and vacuum techniques have to be employed)
Schumann performed pioneering studies and Lyman
recorded the n=1 series of the H-atom in 1914. The understanding of the line
structure remained limited to the hydrogen atom, and even there,
a deeper insight into the origin of the Rydberg regularity was lacking.
 Last change: 6 February 2001
Fraunhofer spectrum of the sun
Balmer series observed in a hot A-type star
J. Rydberg