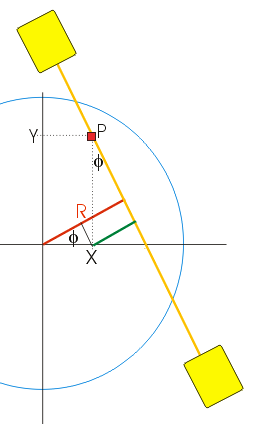
Assume that a source is located in P (see fig. 1) at coordinates (X, Y) on the yellow line connecting the detectors.
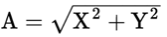
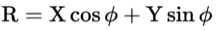
The distance R between the center of the circle and the connecting line is given by:
Figure 1: Setup of the PET simulation
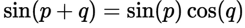
You can verify this by splitting red line in half. The left part is equal to the first term in eq. (1) and the right part is equal in length to the green line, and (from the triangle that includes X and P it follows that) this is equal to the second term in eq. (1).
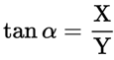
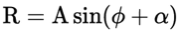
Using
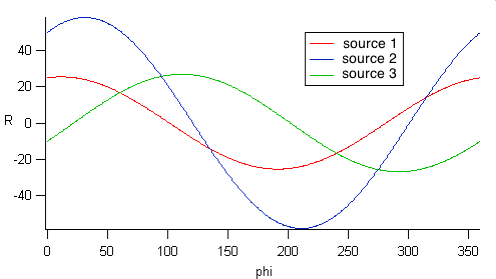
Using eqs. (3-4) a coordinate conversion can be made to generate a sinogram. The amplitude and phase in the sinogram are determined by X and Y.
Als an example fig. 2 shows the sinogram for 3 sources located at the position (X, Y) = (25, 5), (-50, -30) and (-10, 25). Note that the sinograms shown in the PET simulation are rotated by 90 degrees.
Figure 2: An example of a sinogram for 3 sources located at (X,Y) = (25, 5), (-50, -30) and (-10, 25).