The direct back projection introduces as error in the sence that blurring of the activity of the source occurs. This is illustrated using fig. 1.
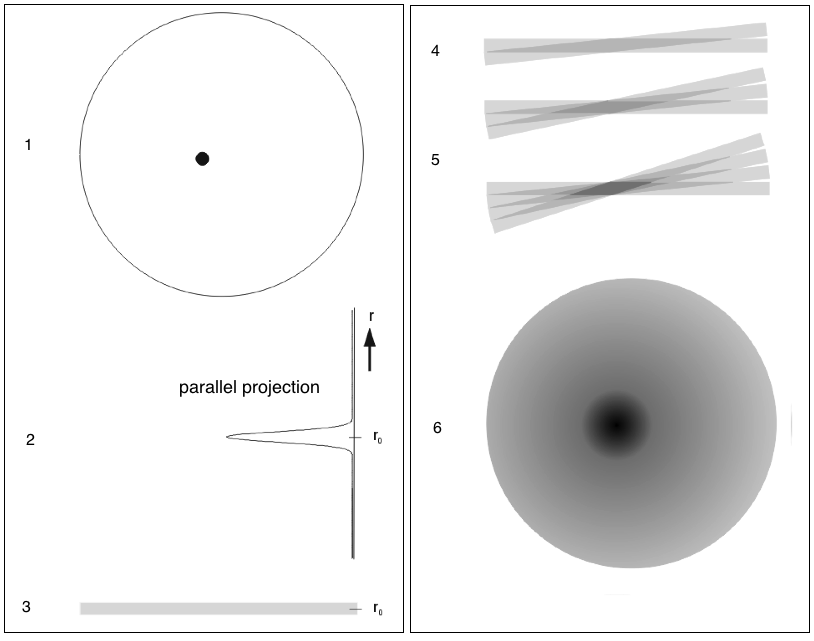
Figure 1: 1/r-blurring. See text below figure for details.
- The original distribution with, in this case, one source.
- The parallel projection measured along the vertical. Roughly halfway down a signal is detected.
- The back projection of the parallel projection. Somewhere along the bar (at posituion r0) the source is located. In the back projection this is represented by a constant value across the whole line.
- The sum of two back projections, which results in constant values across two bars under different angles. At the overlapping part the intensity values double.
- The effect of three and four back projections. The intensity values near the source becomes larger and larger.
- The effect of many projections. At the location of the source there is a high intensity, but this is partly covered by a blurr which extends radially from the source.
At the location r from the source the contributions of N back projections are distributed over the circumference of the circle. Hence, the blurring reduces with 1/r. That's why it is called 1/r-blurring.