Fluorescence measurement
Activate the webcam directed on the leaf of the plant and open the shutter. Check where the laser beam hits the leaf and also check whether graph 1 changes from background noise to a real fluorescence spectrum.
Play around a little with the positioning of the plant leaf. When the laser beam hits a good spot take a fluorescence spectrum, you can continue with a measurement.
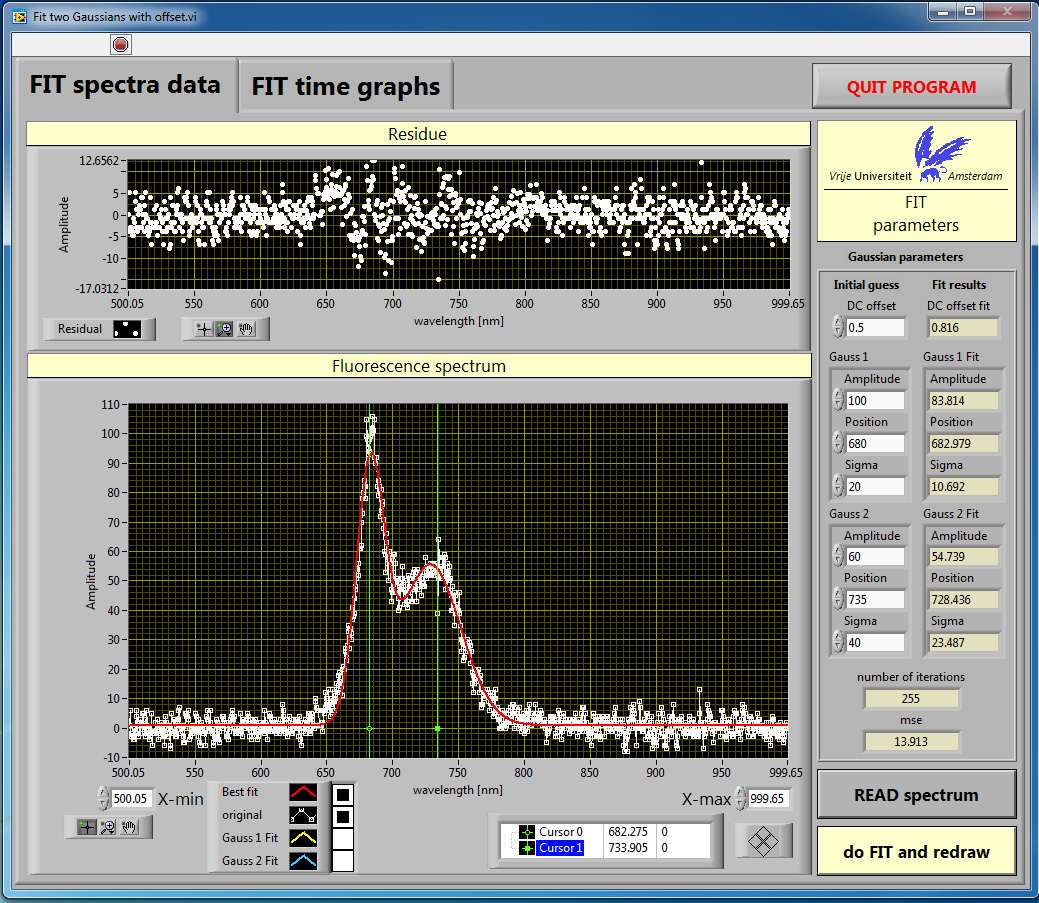
Close the shutter and take a dark spectrum. Subtract the dark spectrum from the fluorescence spectra you will record. Take a good measurement of a fluorescence spectrum, mail the data to yourself and close the shutter. Use the LRS data analysis application to fit the spectra and determine the peak positions, maxima values and the full-width-at-half-maximum (FWHM) of the Gaussians.
Results of example
When you start the LRS data analysis application you first need to load your data by clicking on READ spectrum. Before you run the fit, first enter start values (initial guesses) for the steady-state value, amplitude, position and width of the two peaks. You can move the green vertical cursors shown in figure 4.1 to establish these start values.
Time measurement
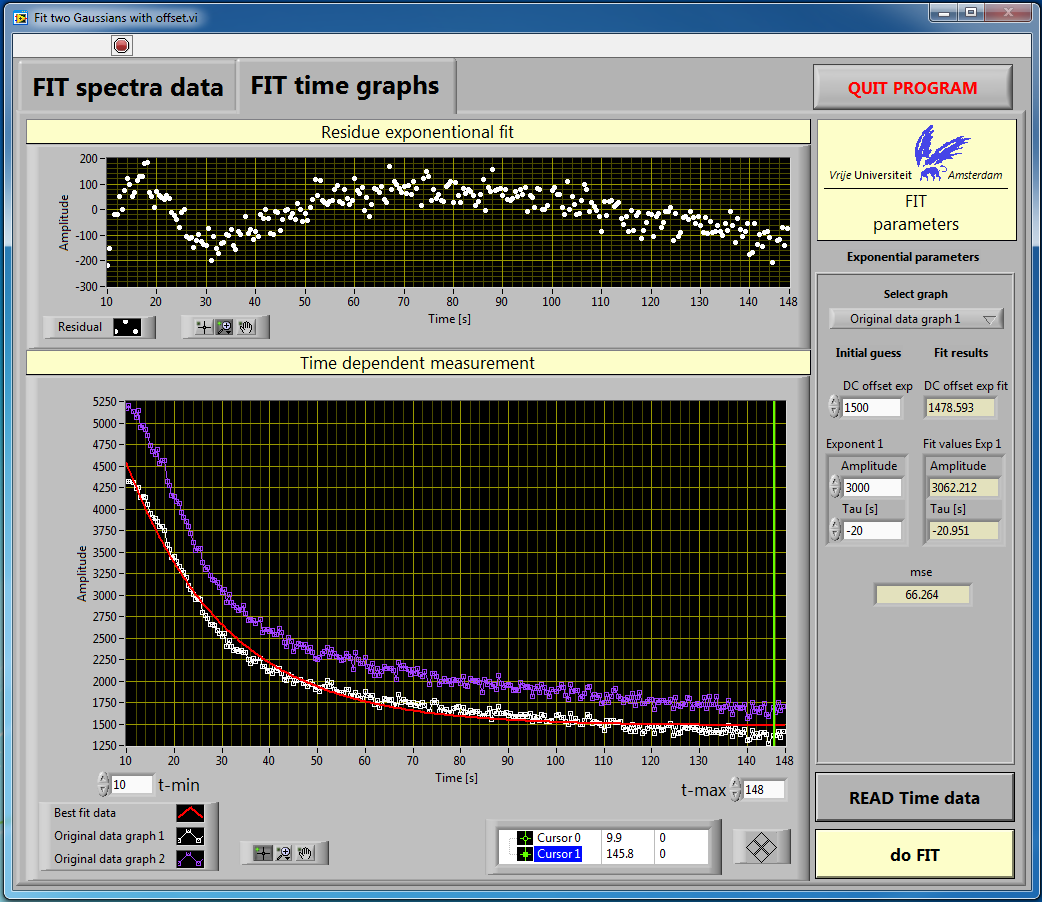
It is also possible to measure the total fluorescence for two wavelength regions simultaneously as a function of time. This is what you will do next. You can select the wavelength regions yourself. Make sure that one of the center wavelengths of fluorescence is included in each region chosen. When you perfom a measurement first close the shutter, then start the time measurement and open the shutter after a few seconds. Then the first few seconds show the baseline, followed by the total fluorescence for the two selected wavelength regions. You can study how the total fluorescence changes over time with regard to the baseline.
After running the measurement for a few minutes you will see that the data traces in the time measurement run nearly horizontal. If that is the case you can end the measurement. Click on Mail Time Data to collect the experimental data. Use the LRS data analysis application to fit the spectra and determine the amplitude and steady-state value of fluorescence, and the mean-squared error (mse).
Results of example
When you start the LRS data analysis application click on the tab Fit time graphs.
First you need to select the range of time that will be used for the fit (t-min and t-max, see figure 4.2). You can move the vertical green cursor again to determine these values. Make sure that t-min is chosen such that the measurement is already running and that the baseline part at the start is removed from the graph. Select either trace 1 or 2, enter initial values and fit the data.
Figure 4.1: Results of a fit of a fluorescence spectrum
Figure 4.2: Results of a fit of a time spectrum