2. Experimental design and   
    measurement
System design

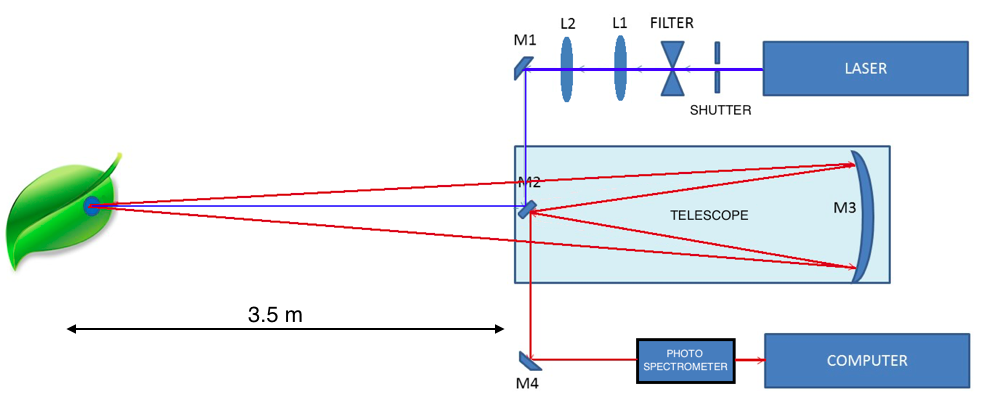
An LRS system in principle consists of a laser as excitation source and a telescope for detection. Excitation and detection are commonly from a very similar angle in order to discriminate between excitation and other effects and to use the same alignment when the set-up moves. By means of a set of mirrors the excitation and detection light are guided such as to come from the same direction. Because detection is done over large distances the measured signals will be very small therefore great care has to be taken to obtain a good signal-to-noise ratio (S/N). The set up for studying Laser induced fluorescence of green plants (see figure 2.1) will be discussed in the following sections.
TOC
Figure 2.1: Schematic of the experimental setup. M1-M4 are mirrors, L1 and L2 are lenses, the fliter is a rotatable gray density filter used to adjust the light intensity of the laser beam exposing the leaf. For details see text.


Illumination

Intense and monochromatic light is needed to excite over great distances and to discriminate between the several processes induced by light in plants. Ideally this is provided by a wide range tuneable laser but the 488 nm line of an Argon laser will work too.

The outcoming laser beam is guided through a pinhole to positive lenses (L1 and L2 in figure 2.1) and into the detection arm by a mirror (M1). There a fixed mirror (M2) projects the beam in a forward direction. A larger or smaller surface of a leave of a plant can be illuminated by adjusting the distance between the two lenses. In the remote lab the distance between the two lenses is fixed and cannot be changed.

By rotating the the gray density filter in the remote lab the output power of the laser can be adjusted.

Detection

Fluorescence is detected by means of a large parabolic mirror which focuses incoming light onto a fixed mirror (M3) which guides the light outside the excitation/detection arm through mirrors M2 and M4 onto an Ocean Optics photospectrometer. So the fluorescence can be measured as a function of the wavelength. The Ocean Optics spectrometer also allows to conduct measurements of integrated fluorescence signals for up to two wavelength regions (integration time of about 200 ms). This allows for dual time measurements at a minimal sample rate of 0.5 s.

^Top
^Top

^Top
Making a reservation for the Laser Remote Sensing experiment

The remote lab can be reached at: http://few.vu.nl/lrs

You will obtain the screen shown in figure 2.2 (if not, or in case you get the message that the experiment is offline, please send an e-mail to Jan Mulder (j.m.mulder@vu.nl).

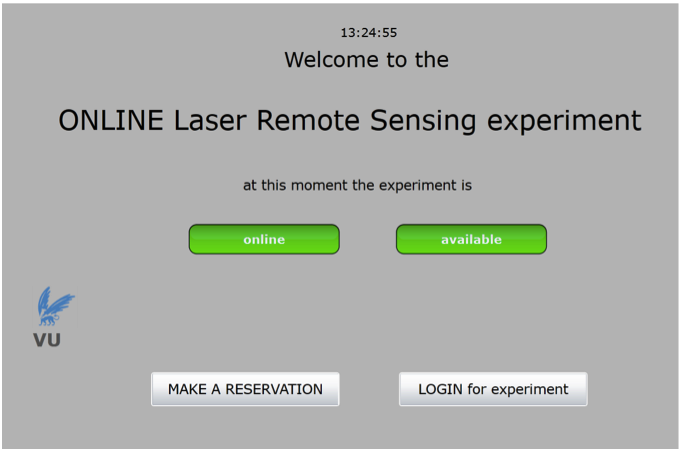
Figure 2.2: Screen for reservation of the remote lab
Before you login to conduct the experiment you first need to make a reservation. This is to ensure that only one user can run the experiment at the time. Click on MAKE A RESERVATION to plan your reservation. The screen in figure 2.3 will be shown:
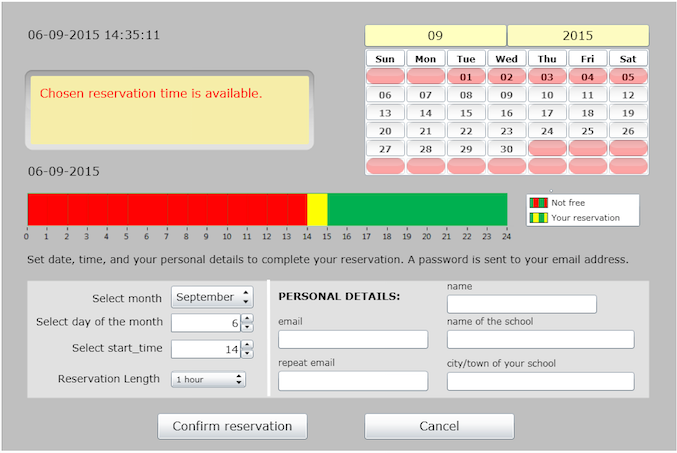
Figure 2.3: Screen for time reservation
At the left bottom of the window select a month and day to schedule your experiment. A reservation always lasts for 1 or 2 hours. You can log in for the start of the hour that you reserve. The bar at the center of the screen shows available time slots for the day you selected. The experiment can be reserved 24 hours a day but please do take into account that plants respond different at night as compared to daytime. On the other hand, it may also be interesting to examine the differences!

Please fill out the remaining parts. Make sure to enter a valid e-mail address. After completing the data you will receive an e-mail at the given address with the timeslot and password to conduct the experiment.

^Top
Start the experiment

On the scheduled day and time log in to conduct the experiment through http://few.vu.nl/lrs.
Click on LOGIN for experiment, which results in the screen shown in figure 2.4.
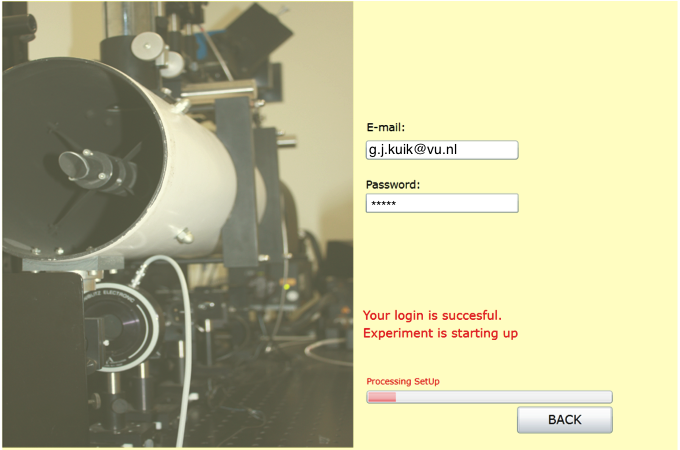
Figure 2.4: Login screen to start remote lab
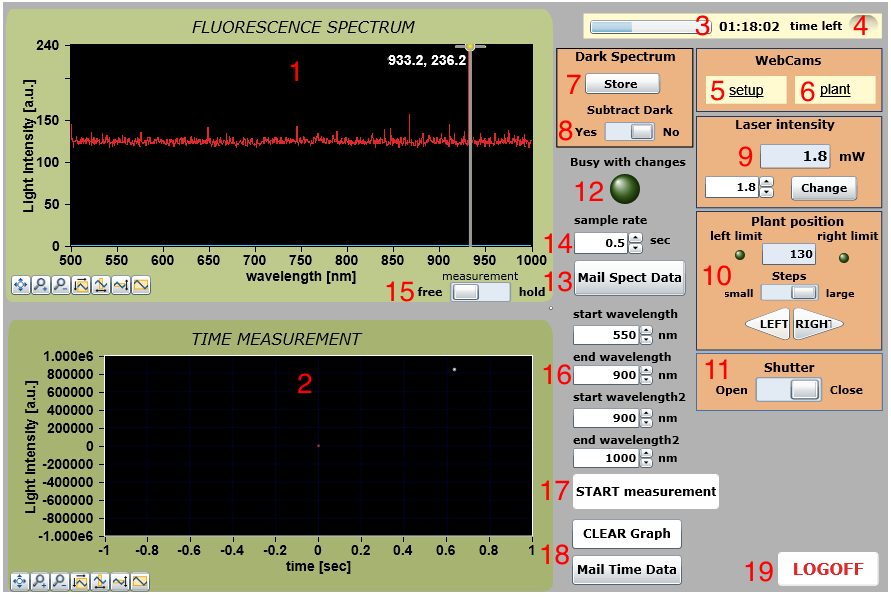
Enter your e-mail address and password. The system will start up. This takes about a minute. The control panel shown below in figure 2.5 will appear:
Figure 2.5: The LRS web interface. For details see text.
  1. This graph shows the fluorescence spectrum of the leaf. As the shutter is closed the chlorophylls in the leaf do not fluoresce so what is visible is background noise, also called the dark spectrum (see (7) and (8)). Vertical cursors are available in the graph and can be dragged using your mouse allowing accurate determination of wavelengths of peaks.
  2. This graph shows the total fluorescence light intensity over time for two selected wavelength regions (see (15)) after starting the measurement (see (16)). Also in this graph vertical cursors are available to select time regions.
  3. The timer shows how much longer you can experiment. From the moment your reservation starts you get 55 (or 115) minutes to conduct the experiment.
  4. A light signal will be given when only 5 minutes are left. This means you need to wrap up your experiment.
  5. A link, which pops up a new tab window that shows the image of a webcam directed on the experimental setup. If you keep the shift key pressed the image will be shown in a new browser window (handy!).
  6. A link, which pops up a new tab window that show the image of a webcam directed on the leaf of the plant under investigation. If you keep the shift key pressed the image will be shown in a new browser window (handy!).
  7. When you click on this button the dark spectrum will be stored in memory.
  8. After you have stored the dark spectrum you can set the slide to Yes to subtract the dark spectrum from the fluorescence spectrum.
  9. The laser intensity can be adjusted here. On the left you set the desired intensity. Only after you click on Change the intensity will be adjusted. The indicator on top shows actual the laser intensity.
  10. These buttons can be used to adjust the position of the leaf of the plant (the plant is positioned on a movable platform). Coarse and fine adjustments can be made. The webcam image of the leaf of the plant (see (6)) can be used to monitor the laser spot on the leaf.
  11. This switch opens and closes the shutter, which in effect starts and ends a continuous fluorescence measurement (shown in graph 1).
  12. When Busy with changes lights up adjustments in the setup are made. You cannot make any adjustments until the light is off.
  13. When you click this button the fluorescence spectrum shown in graph 1 will be e-mailed to the e-mail address you used to reserve the experiment.
  14. When you take time measurements the sample time reflects how often per second samples are collected from the fluorescence spectrum.
  15. You can freeze the graph displayed on screen (in the background the measurement continues). Convenient e.g. when you want to read out cursor values.
  16. Here you can set values for two wavelength ranges (in nm) can be monitored over time for time measurements.
  17. Click on this button to start a time measurement. The button will change into STOP measurement once you start a time measurement.
  18. Only after taking a time measurement these buttons will appear. CLEAR graph can be used to remove the last time measurement recording. Mail Time Data may be used to e-mail the time data measurement to yourself.
  19. Click here to log off to end the experiment. The data taken last (fluorescence spectrum and if applicable time measurement) will automatically be e-mailed to yourself.

^Top