The survey “Beeldvorming duurzame energie in Nederland” investigates the general opinion of the Dutch population about specific renewable energy systems (wind, solar thermal, solar PV). In this page, we will quickly go through some of the results extracted from the survey output.
Goal of the survey was to gather information about thermal solar collector systems, relative to other conventional domestic renewable energy systems. The results from the survey will help us to develop a new type of thermal solar collector which will fit with the needs of potential customers.
ResearchThe questionnaire was mainly spread via the university network. It was chosen to use only a Dutch version of the survey to avoid results from inhabitants of other countries which would spoil the result of the Dutch vision on sustainable energy in the Netherlands. As a stimulator for filling in the survey, two people received the book “sustainable energy without the hot air” of David JC MacKay.
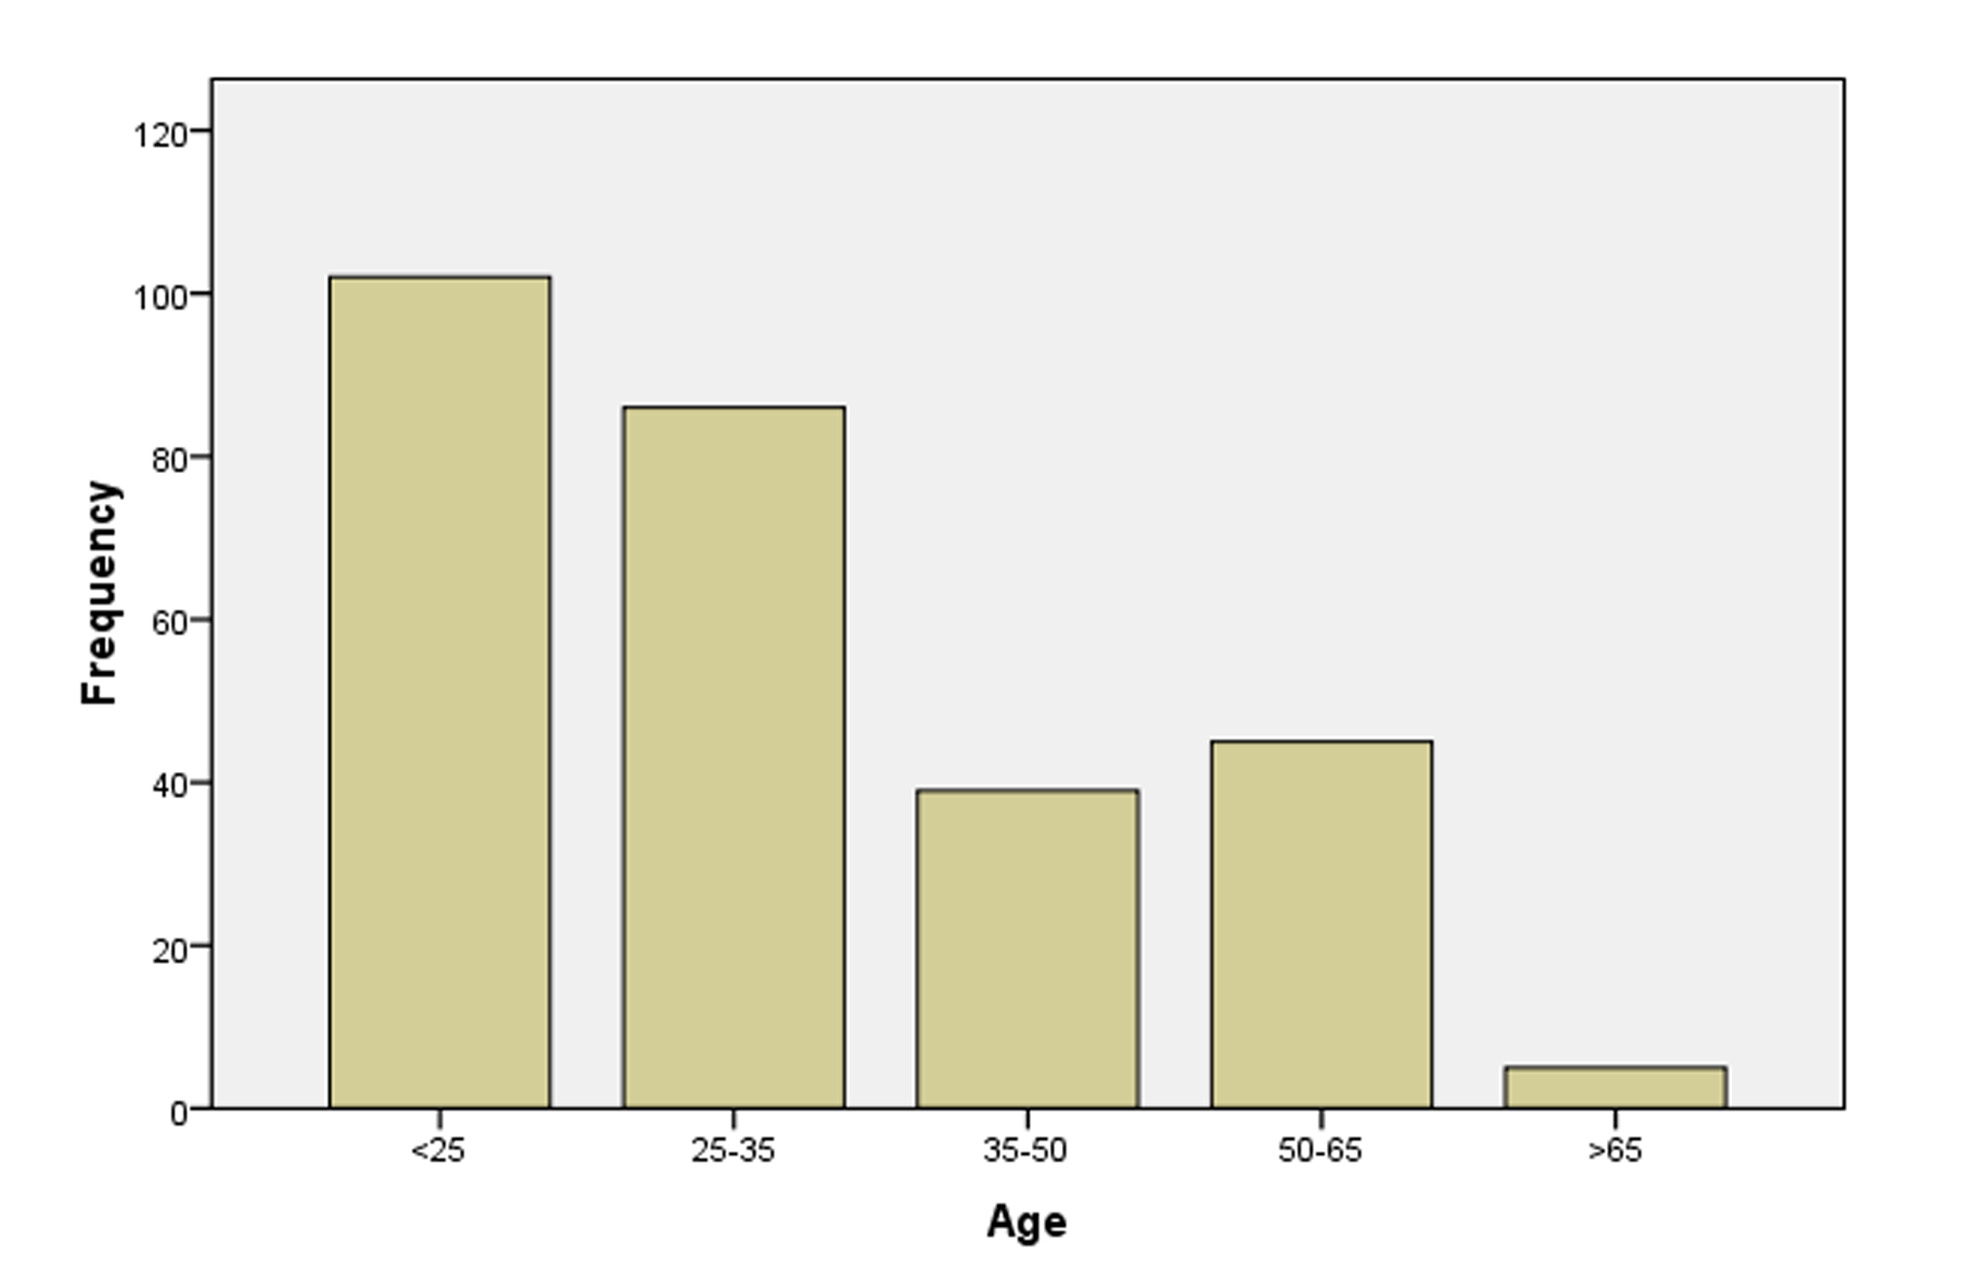
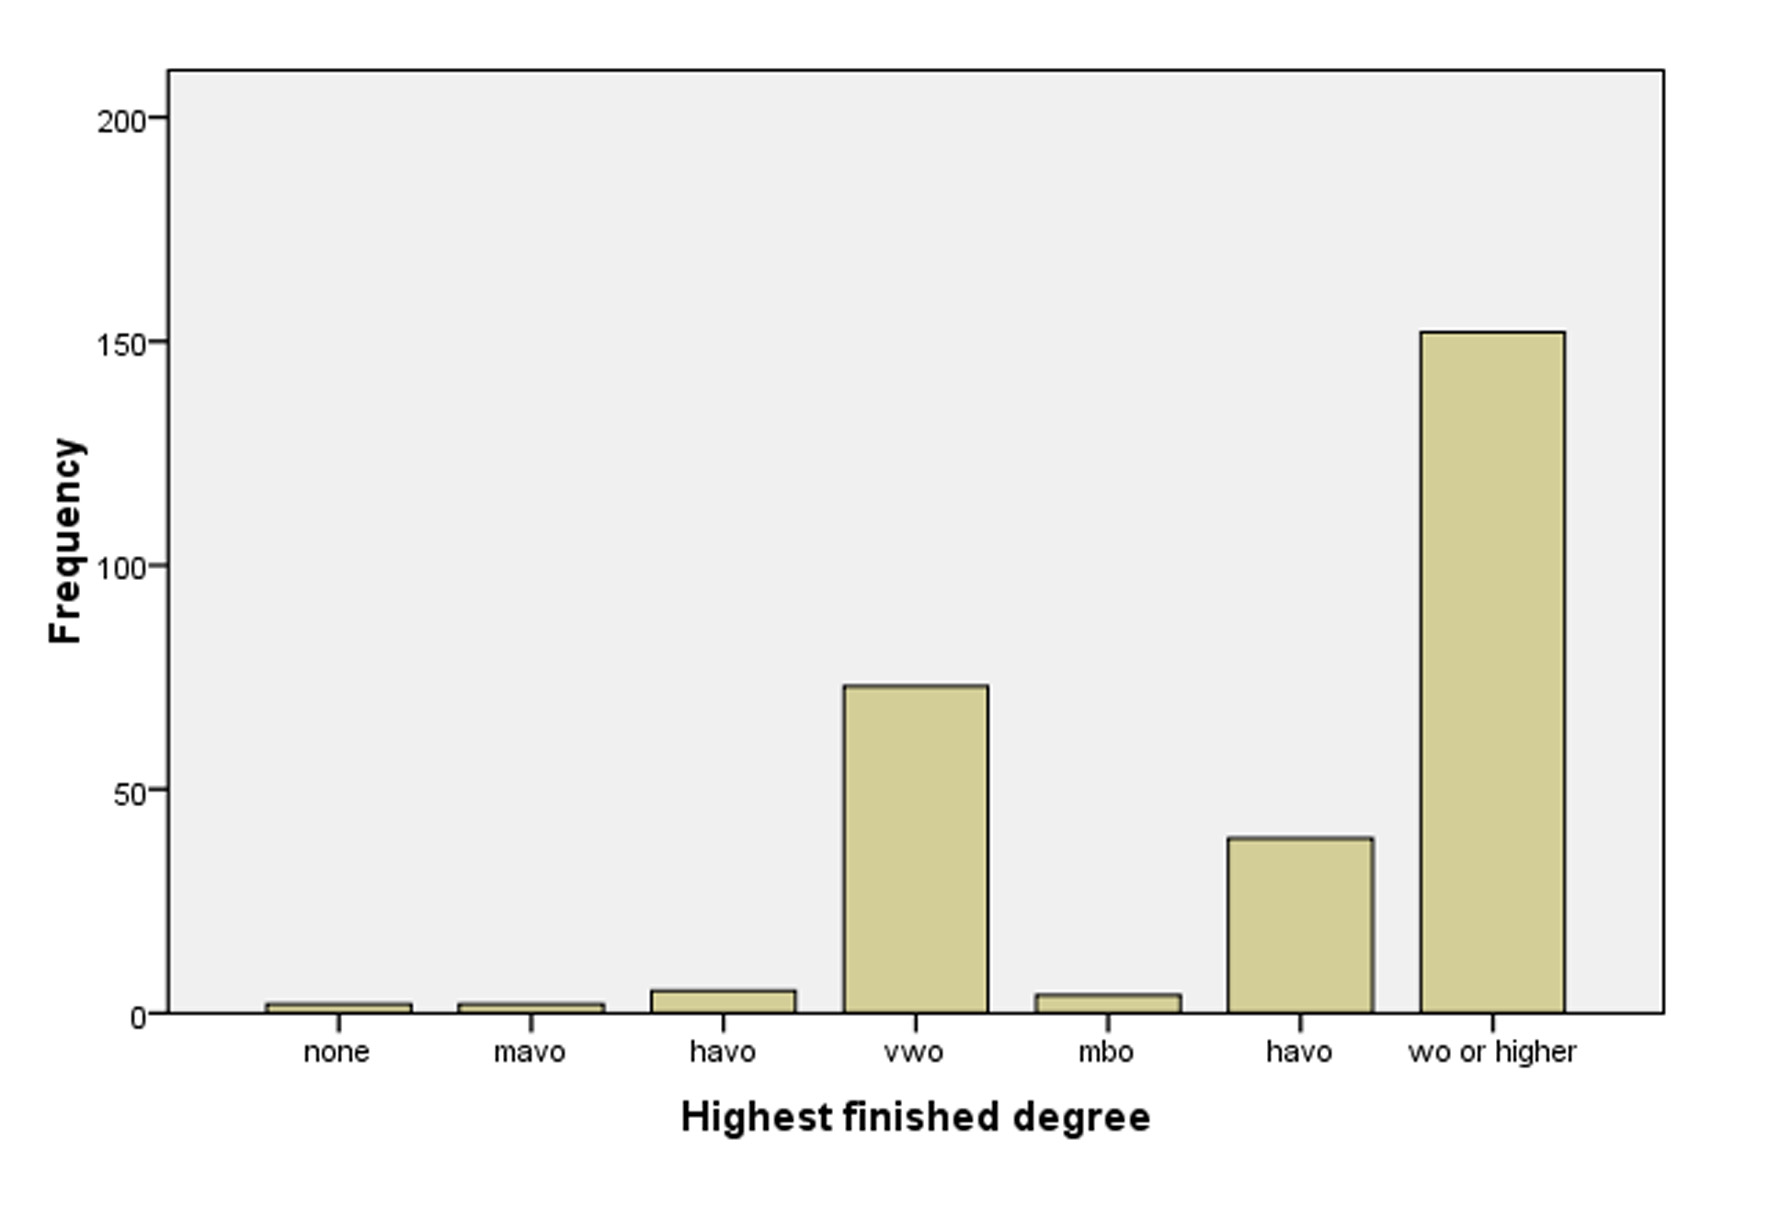
The data set (N=317) consists mainly out of university staff personal and students. Therefore, the data is somewhat biased (see figure 1 and 2) and cannot be used to extrapolate conclusions that concern the society as a whole. However, the data can still be used to acquire valuable insights.
|
|
|
| Figure 1: Age of the data population. |
|
|
|
| Figure 2: Highest finished degree of the data population. |
Results
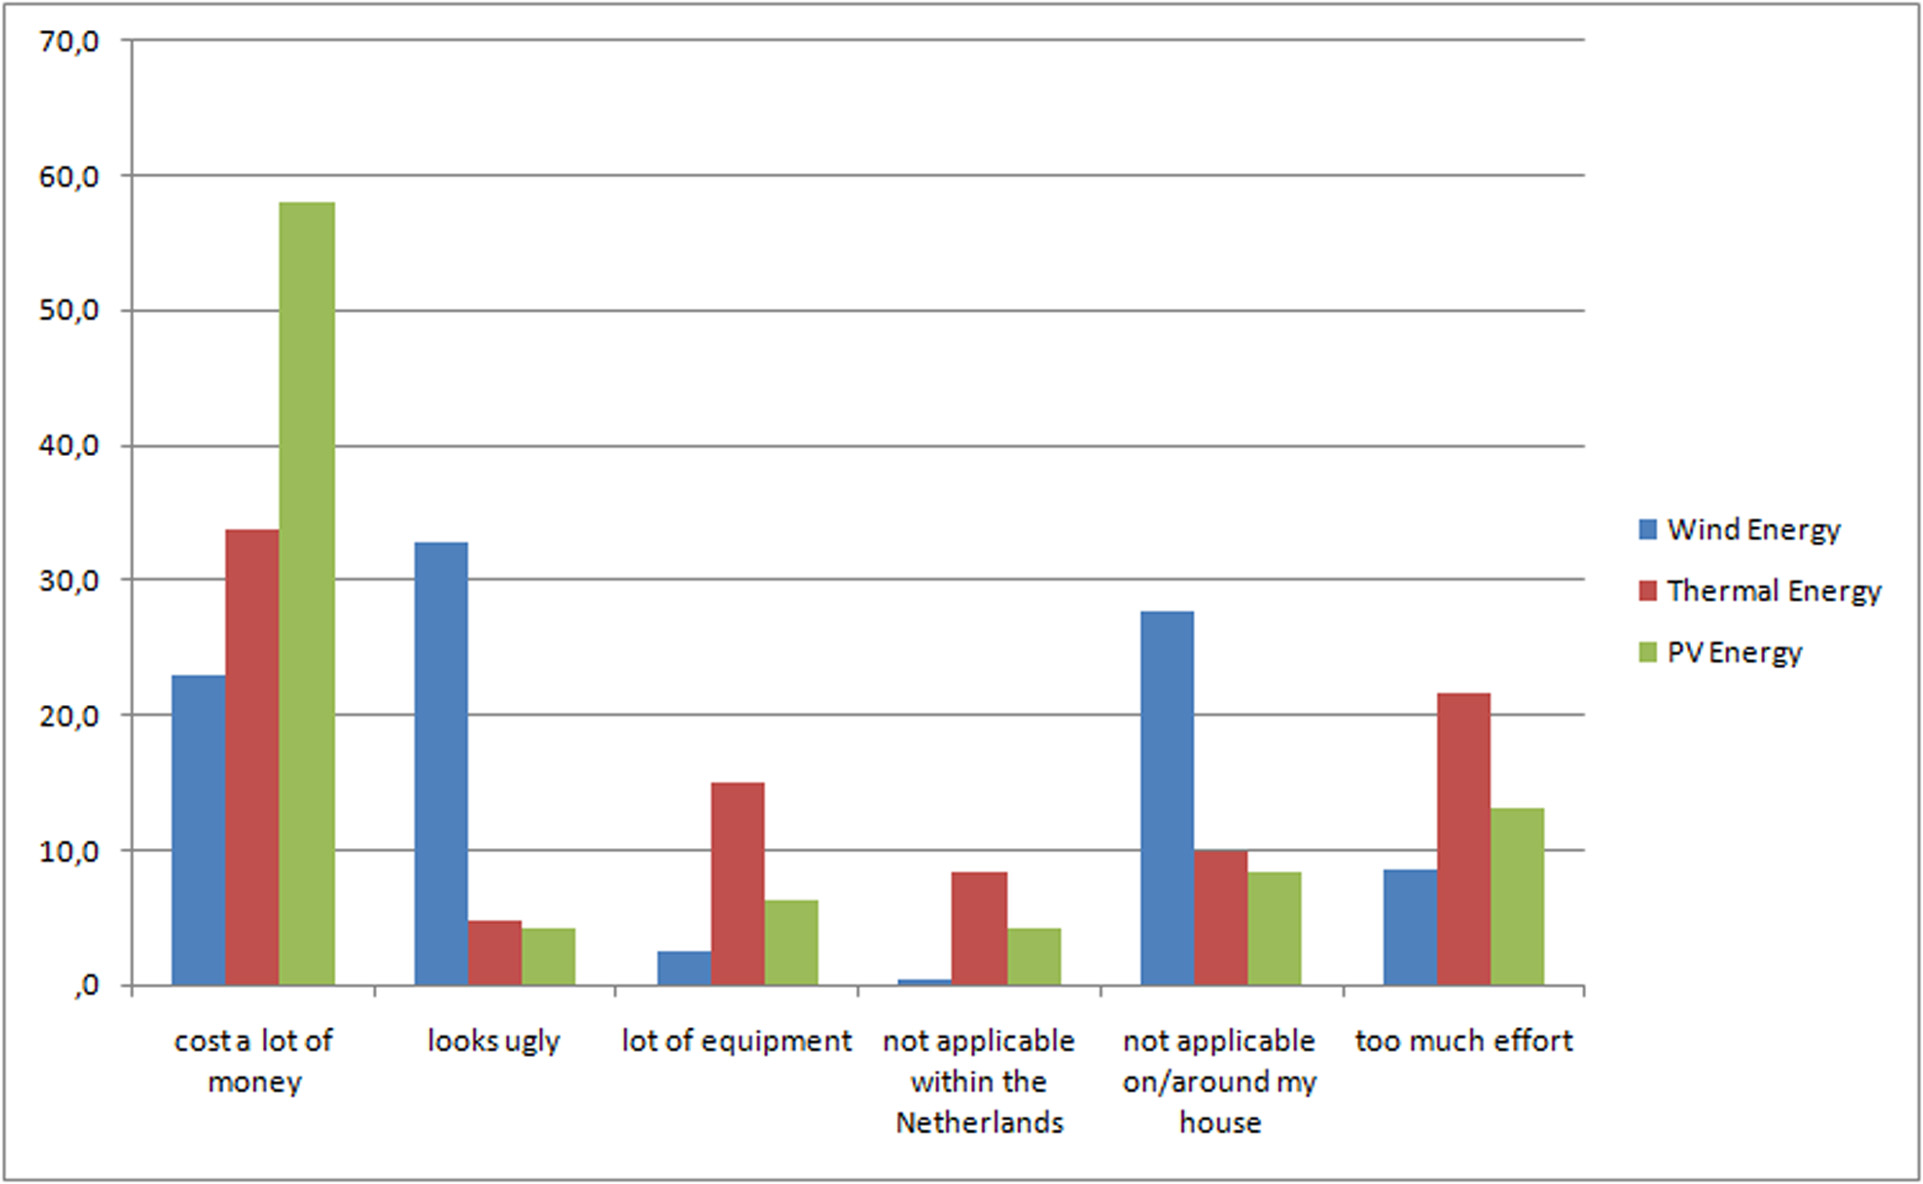
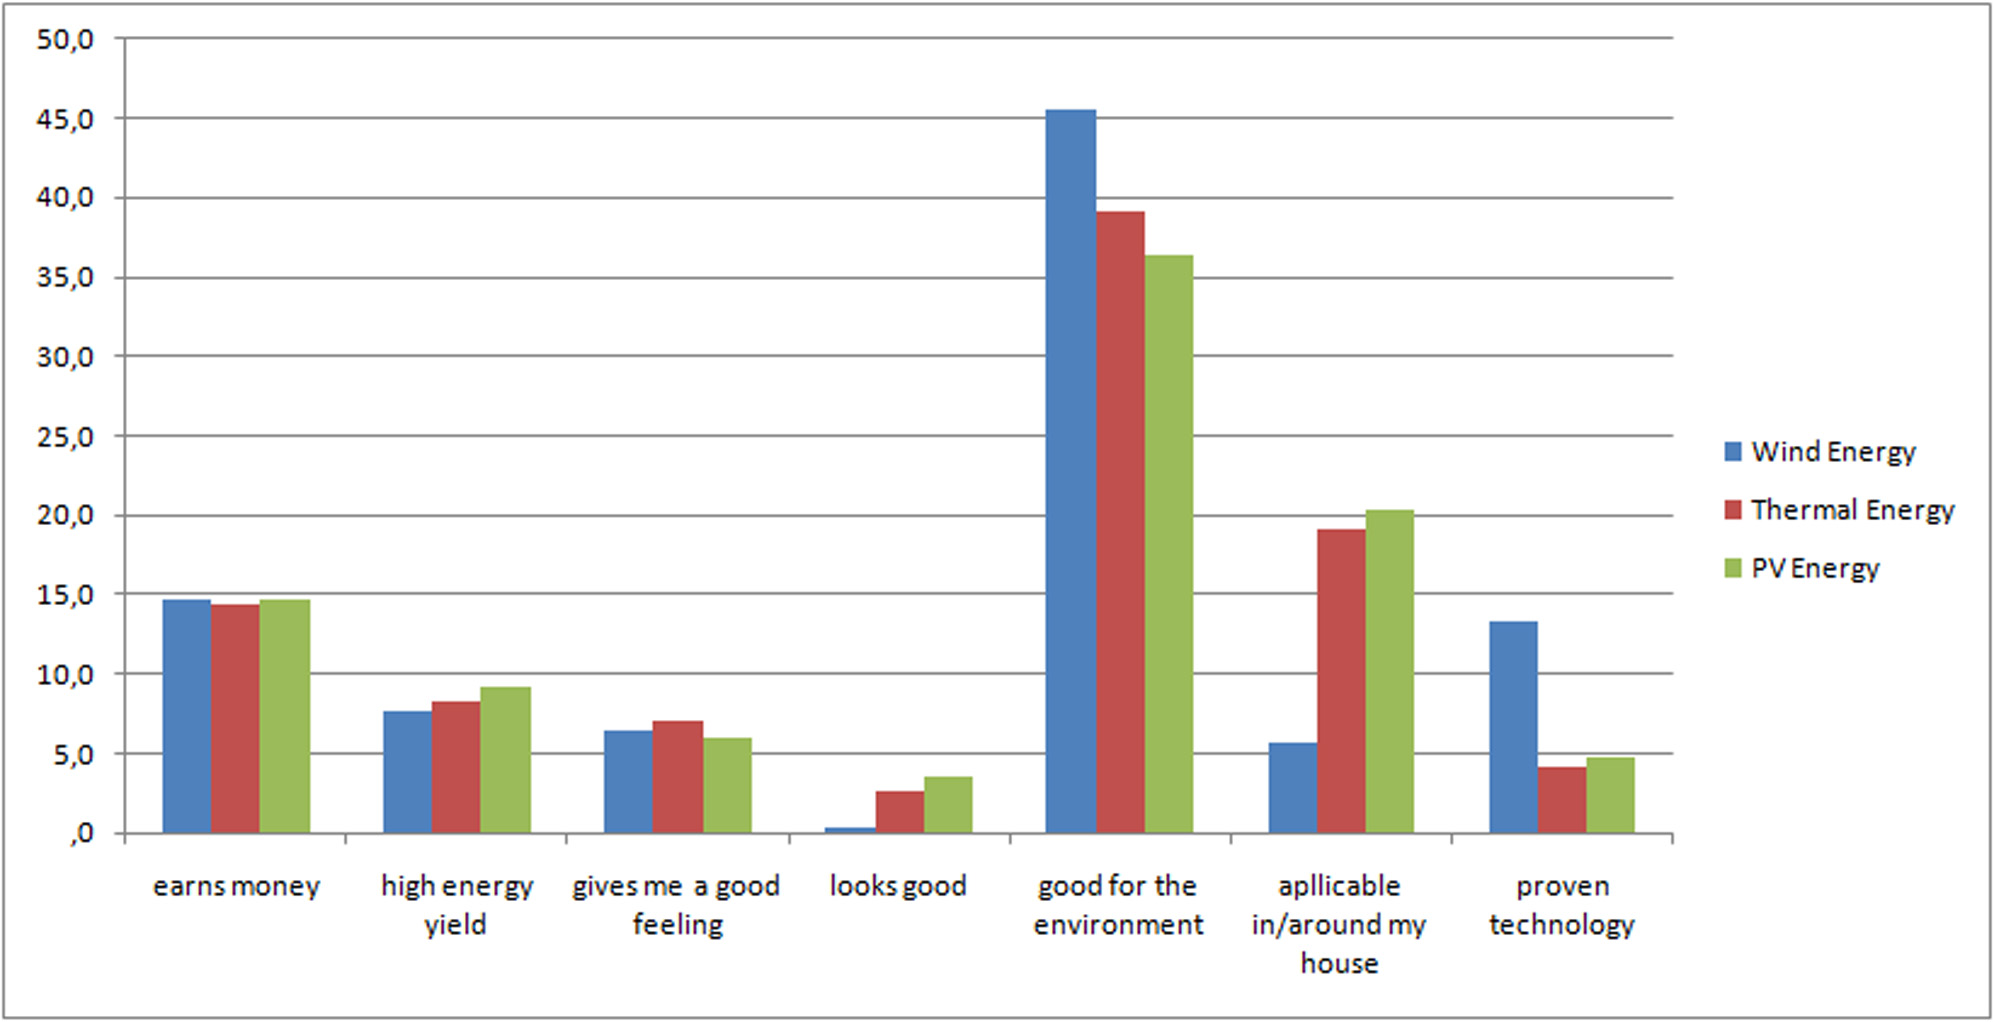
The first questions concerned the most important advantages, or disadvantages during the procedure of buying one of the three renewable energy solutions wind, solar thermal and solar Photovoltaic (PV). The results are shown in figure 3 and 4.
The environment is mentioned as the most
important issue when investing in sustainable energy solutions. Earning
money
seems to be a much smaller issue. From this one might expect that
people buy a
lot of sustainable energy products, but they aren’t. An
explanation might be
that the disadvantages from figure
4 are more dominant in the buying decision
than the advantages mentioned in figure
3. From figure 4 we learn
that overall, costs are the most prominent disadvantage.
Considering the differences between the three
energy solutions, it can be seen from that all three technologies are
thought
to have similar advantages. Wind energy is considered less applicable
for the
domestic environment.
The disadvantages show more variety within the
results. Concerning PV-energy, the costs are considered to be the main
disadvantage (while in reality it is the cheapest of the three). Wind
energy is
considered aesthetically unsatisfying while domestic applicability also
seems important. Finally, for solar thermal energy
–again- the
costs are the most dominant disadvantage, although effort is also
considered
quite an issue. Thus, it appears that the respondents have some
knowledge of
the difficulties involved related to the installation of solar thermal
systems.
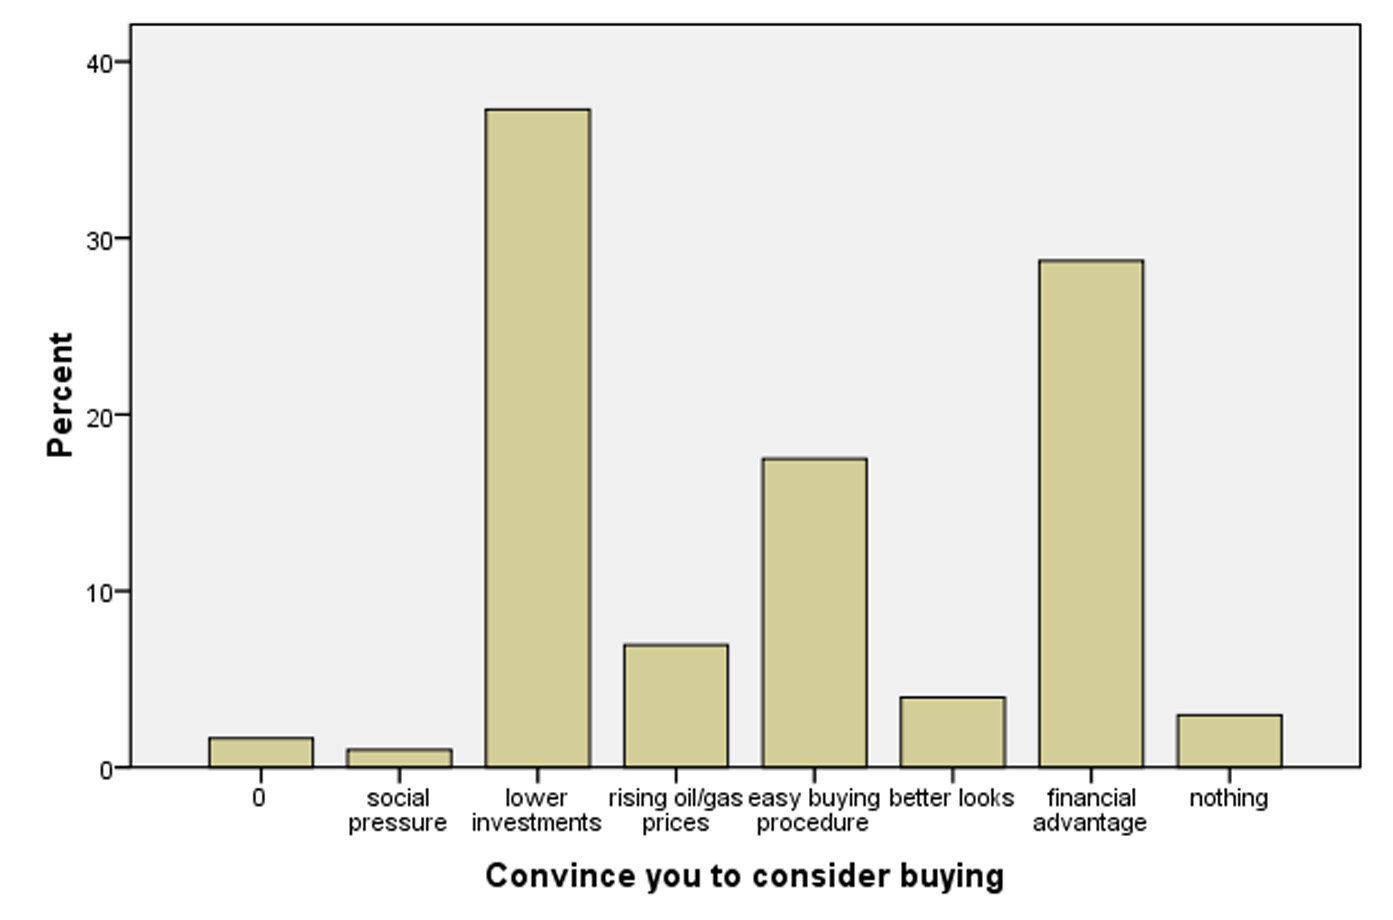
Although the respondents stated that the environment is the most important advantage, when buying sustainable energy solutions, the reality appears to be different. The reason for this becomes clear when the respondents are asked what can be the decisive factor to buy a sustainable energy solution at this moment. Lower investments and financial advantage are the most frequent answers (figure 5). Thus, it is concluded that there is a strong demand for costs reduction of these energy sources.
 |
|
| Figure 3 “If you would consider buying one of the sustainability solutions (wind, solar thermal, solar photo voltaic), what would be the most important advantage in doing so?” |
|
|
|
| Figure 4:“If you would consider buying one of the sustainability solutions (wind, solar thermal, solar photo voltaic), what would be the most important disadvantage in doing so?” |
|
|
|
| Figure 5: “What can be a decisive factor to convince you to buy one of the sustainable energy solutions?” |
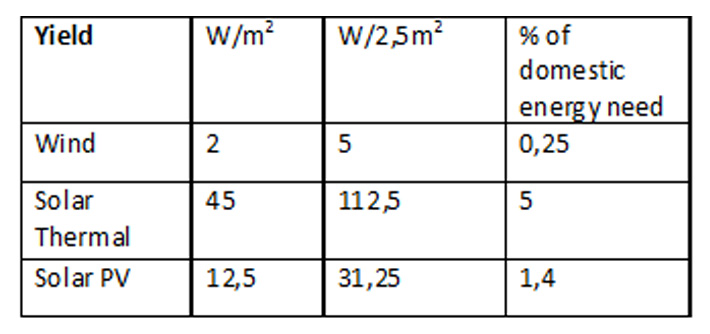
For the next part of the survey, three standard domestic energy systems where introduced (for wind, solar thermal, solar PV), including a small description (e.g. an effective surface area of 2,5m2).
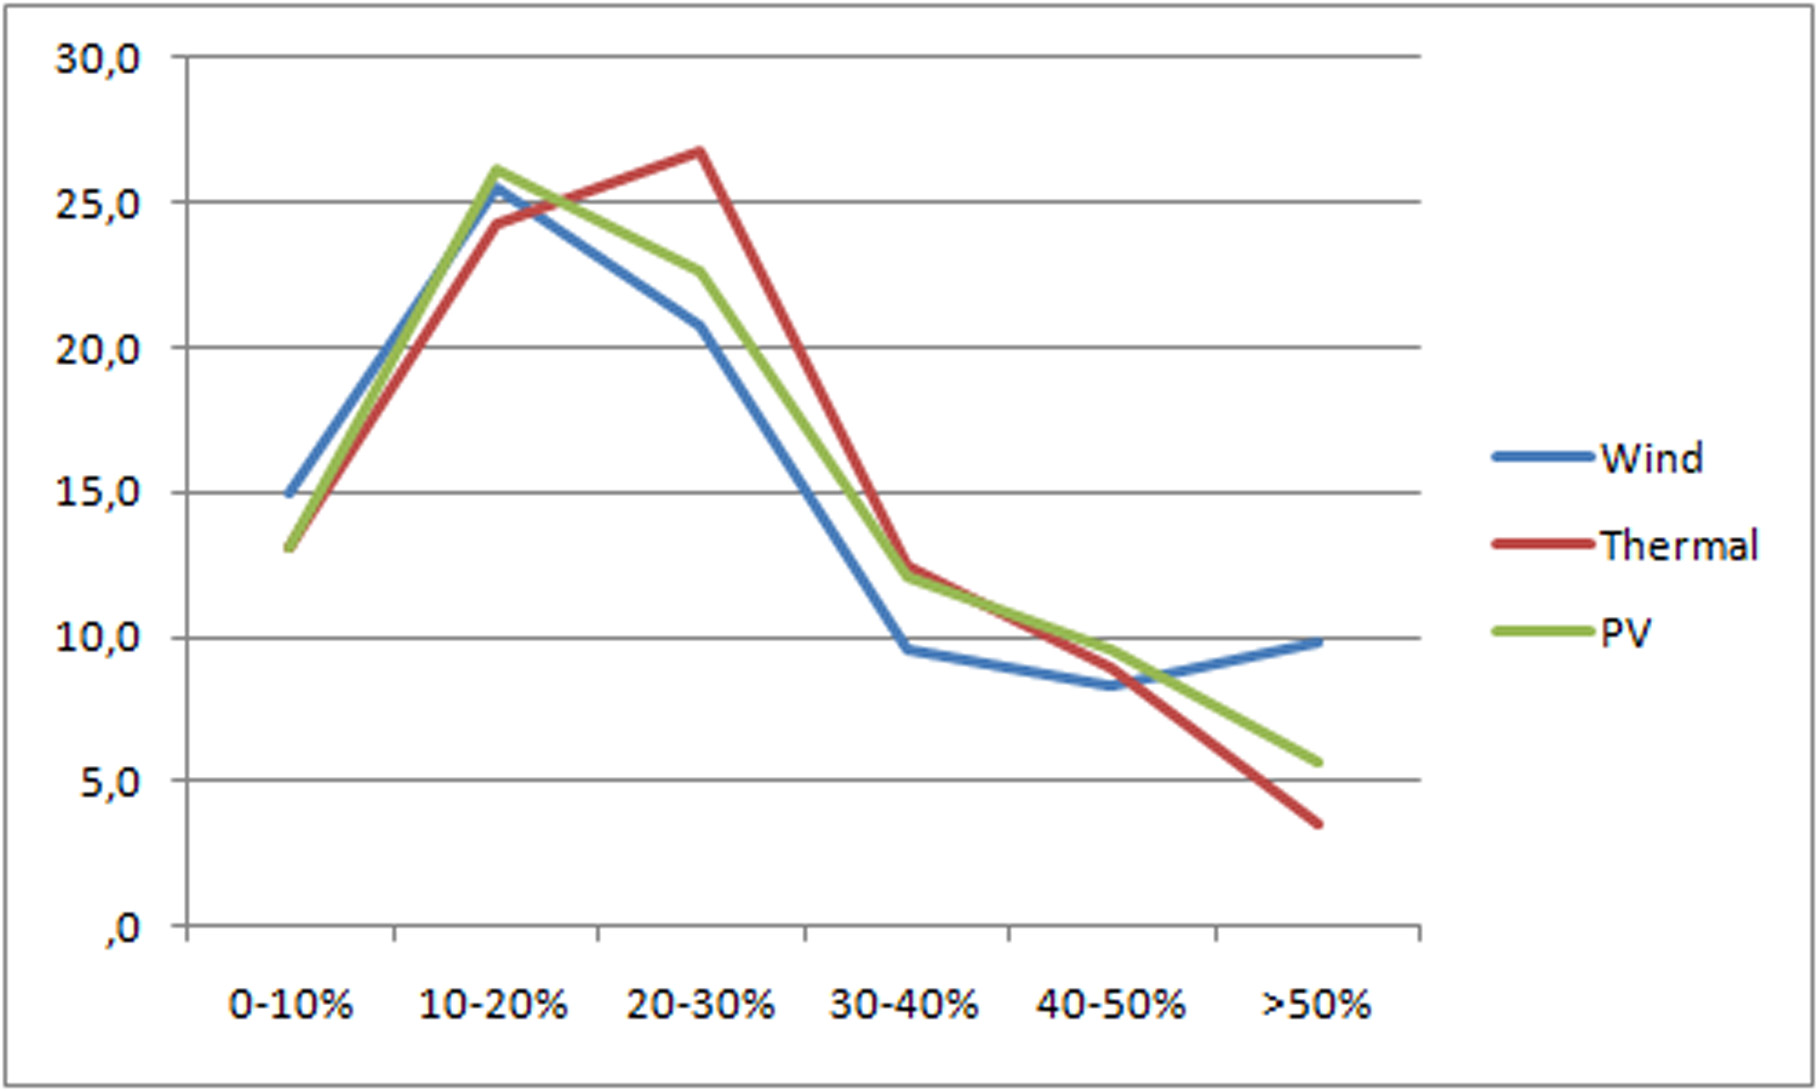
When asked to estimate the energy yield of the domestic energy systems in percentage of the total domestic energy need, respondents tended to estimate very high fractions (figure 6). The results peak between 15-30%, while in reality the energy yield is more as in figure 7.
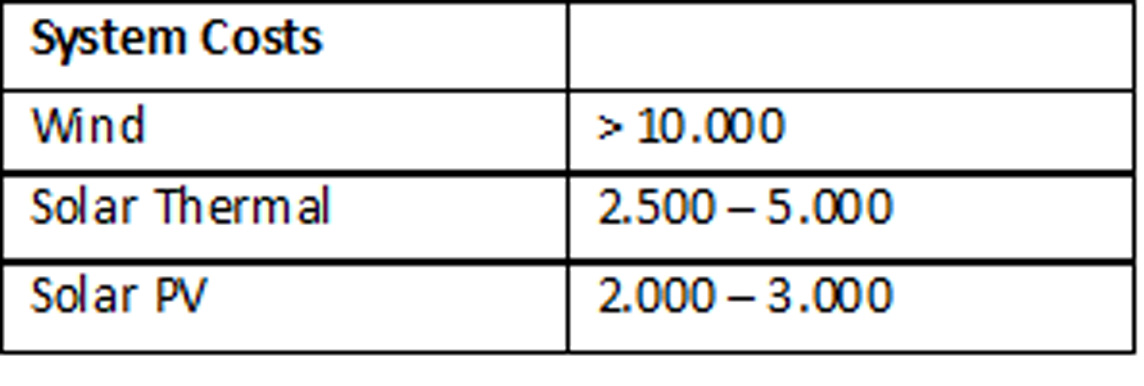
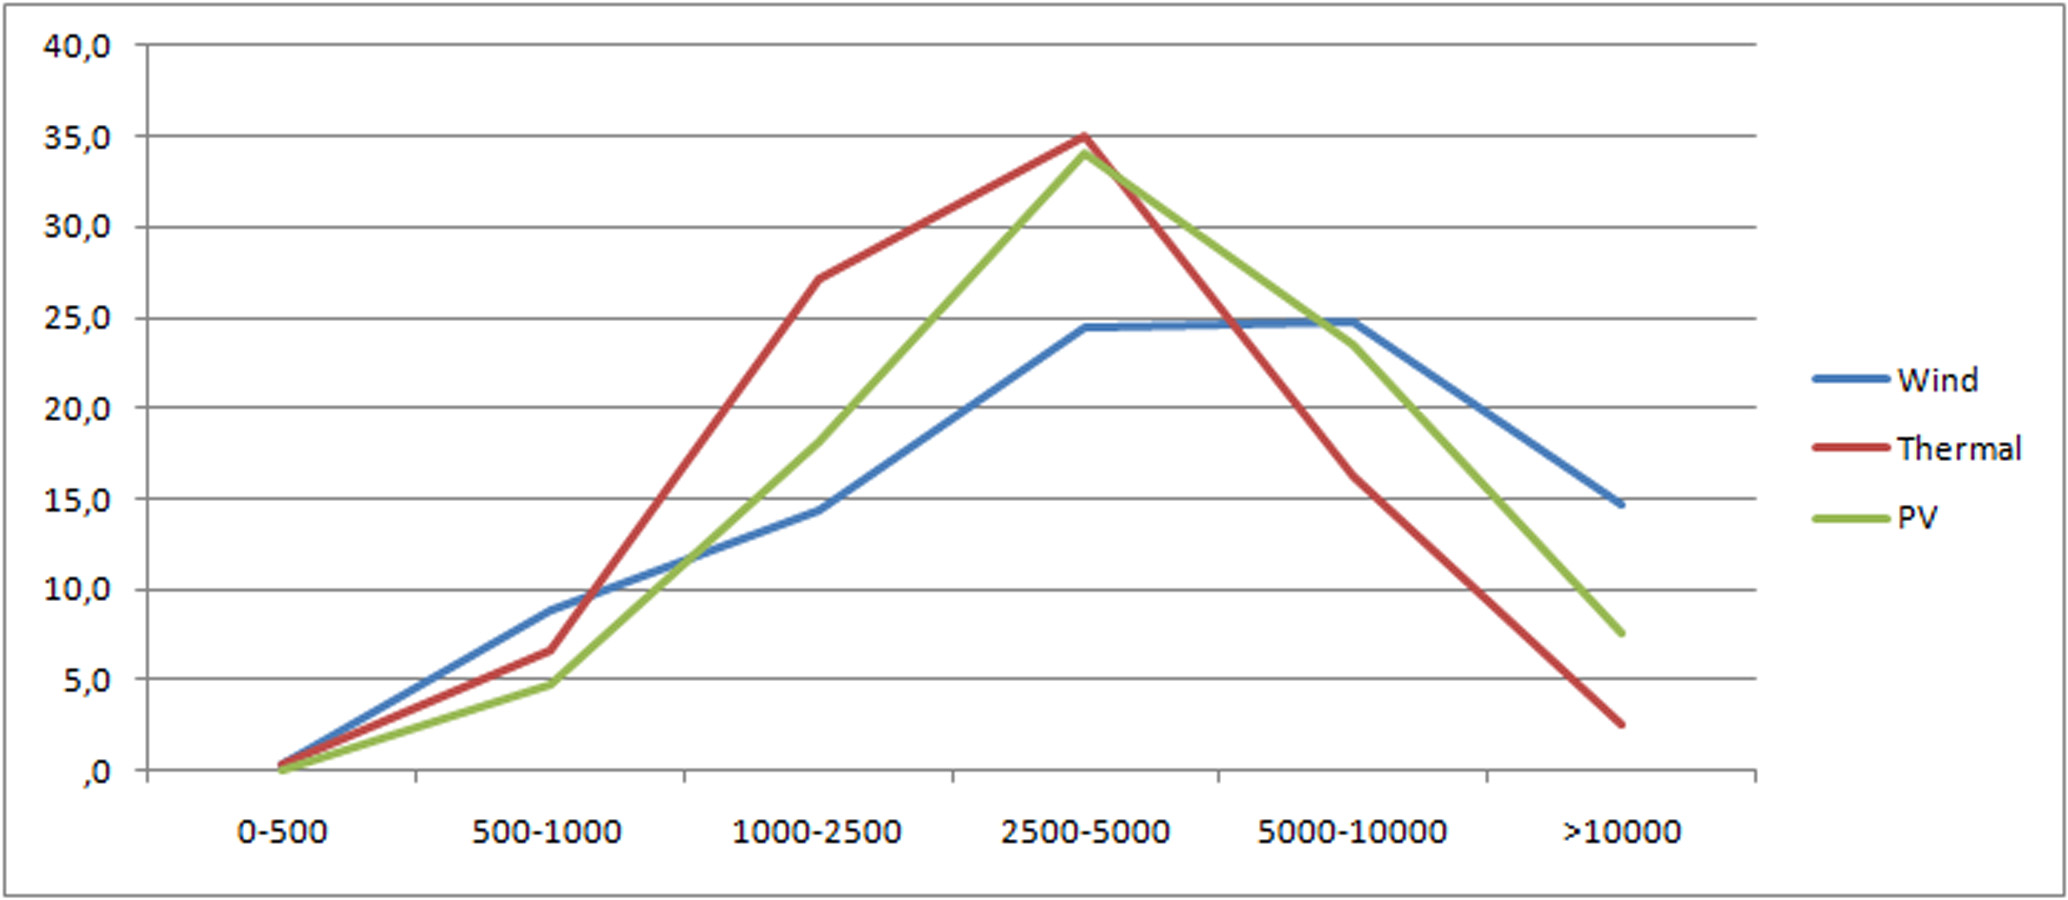
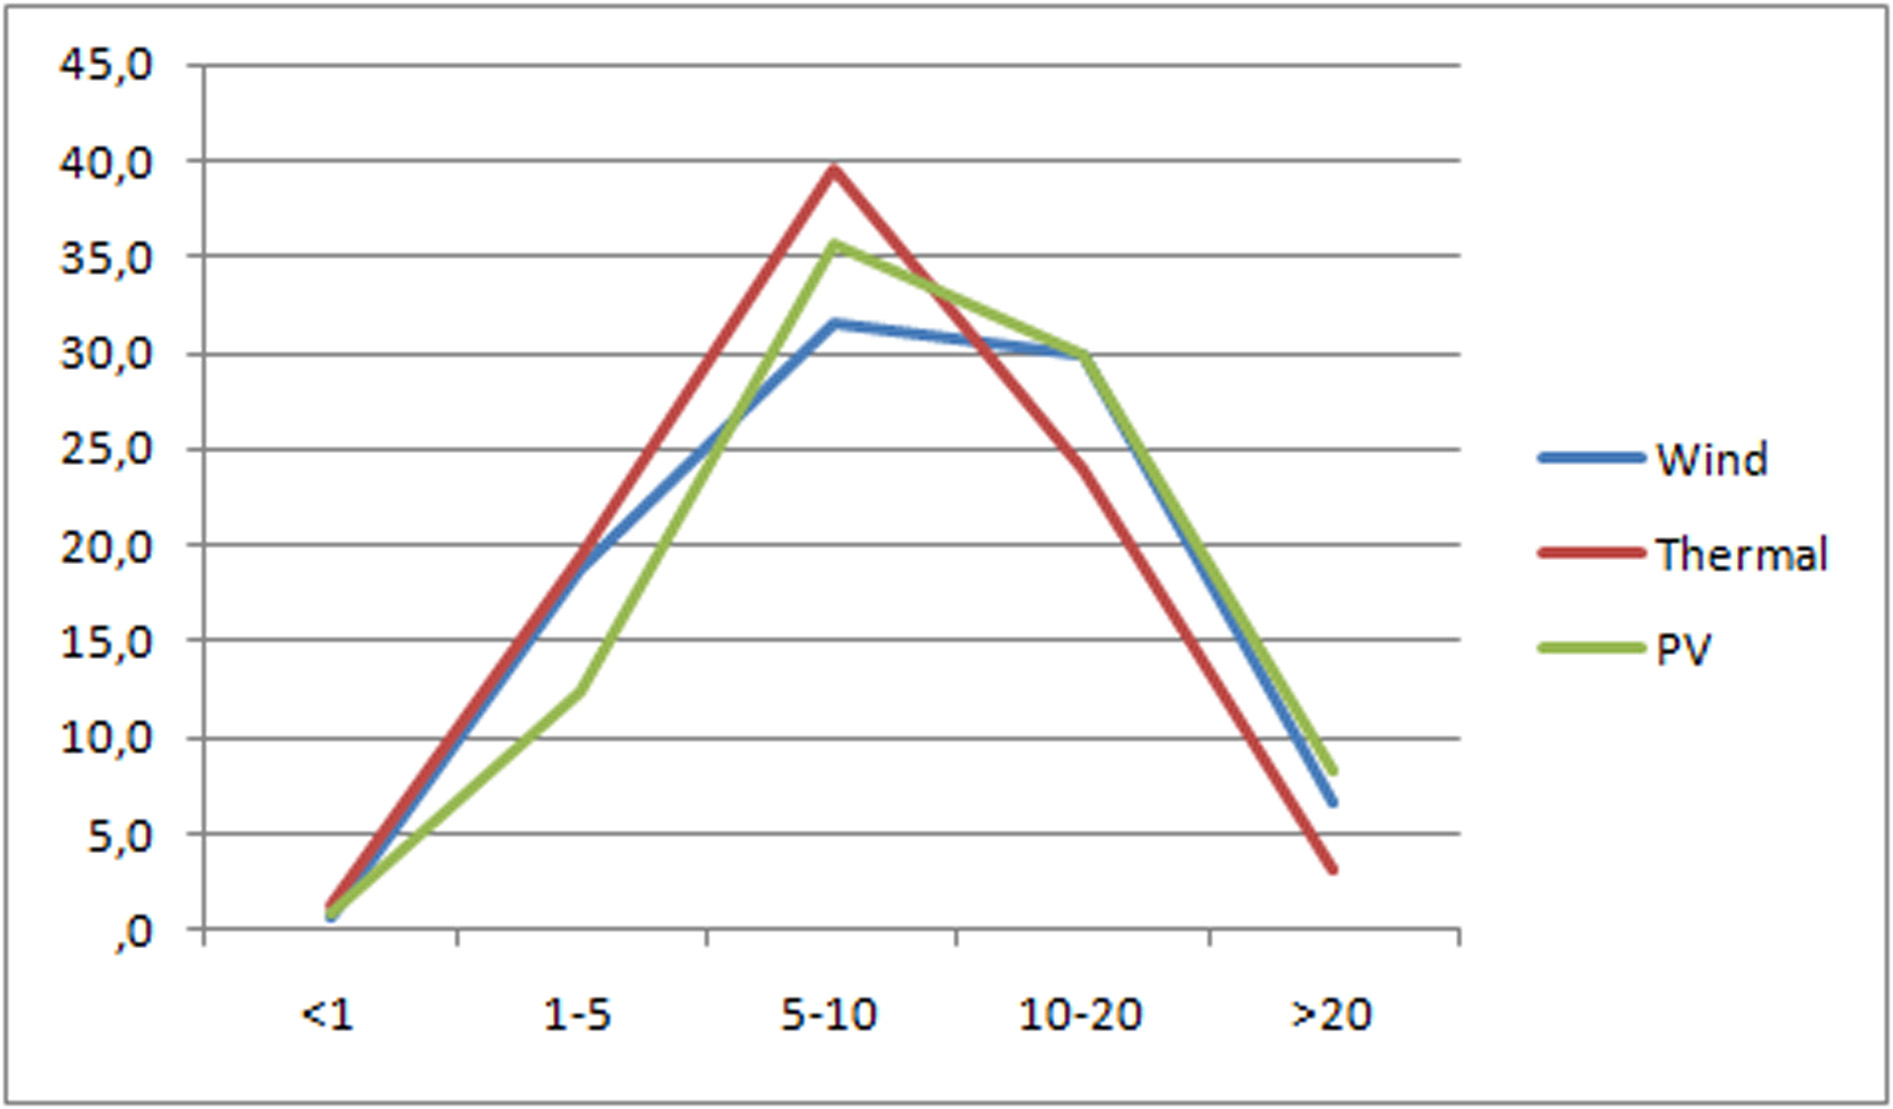
Next, the respondents were asked about total system costs, including installation and excluding subsidies (figure 8). The results show that when considering wind energy the respondents don’t appear to have much knowledge about the costs involved and the answers are highly spread. For solar thermal and solar PV the response seems more accurate. The curve for solar thermal energy peaks around its realistic value, while the curve of PV energy is shifted to the right, and thus estimated too high.
|
|
|
|
Figure 6:“How much energy can a fully operational domestic system generate in % of the domestic energy need?” |
|
|
|
| Figure 7: Real energy yield, for specified systems, in percentage of the total domestic energy need for an average household. |
|
|
|
|
Figure 8:System costs. “What are the total costs of a fully operational system (incl. install, excl. subsidies)?” |
|
|
|
| Figure 9: Total costs indication for specified systems, including installation and excluding subsidies. |
The payback time of sustainable energy solutions is in reality much longer than most of the respondents think (figure 10). For PV energy, and wind energy it can be calculated that payback times exceed lifetimes (for domestic applications) and are therefore not even feasible, despite the fact that many providers claim payback times between 10-15 years. For solar thermal energy, lifetimes are calculated to be somewhere between 15-25 years.
 |
|
|
Figure 10: Payback times. “What is the economic payback time of a fully operational system?” |
Now, if we subtract the payback time from the lifetime we are left with the amount of years that the respondents think that they will make profit. If lifetimes are somewhere around 20 years and payback times around 10 years, the respondents think to make profit for about 10 years.
 |
|
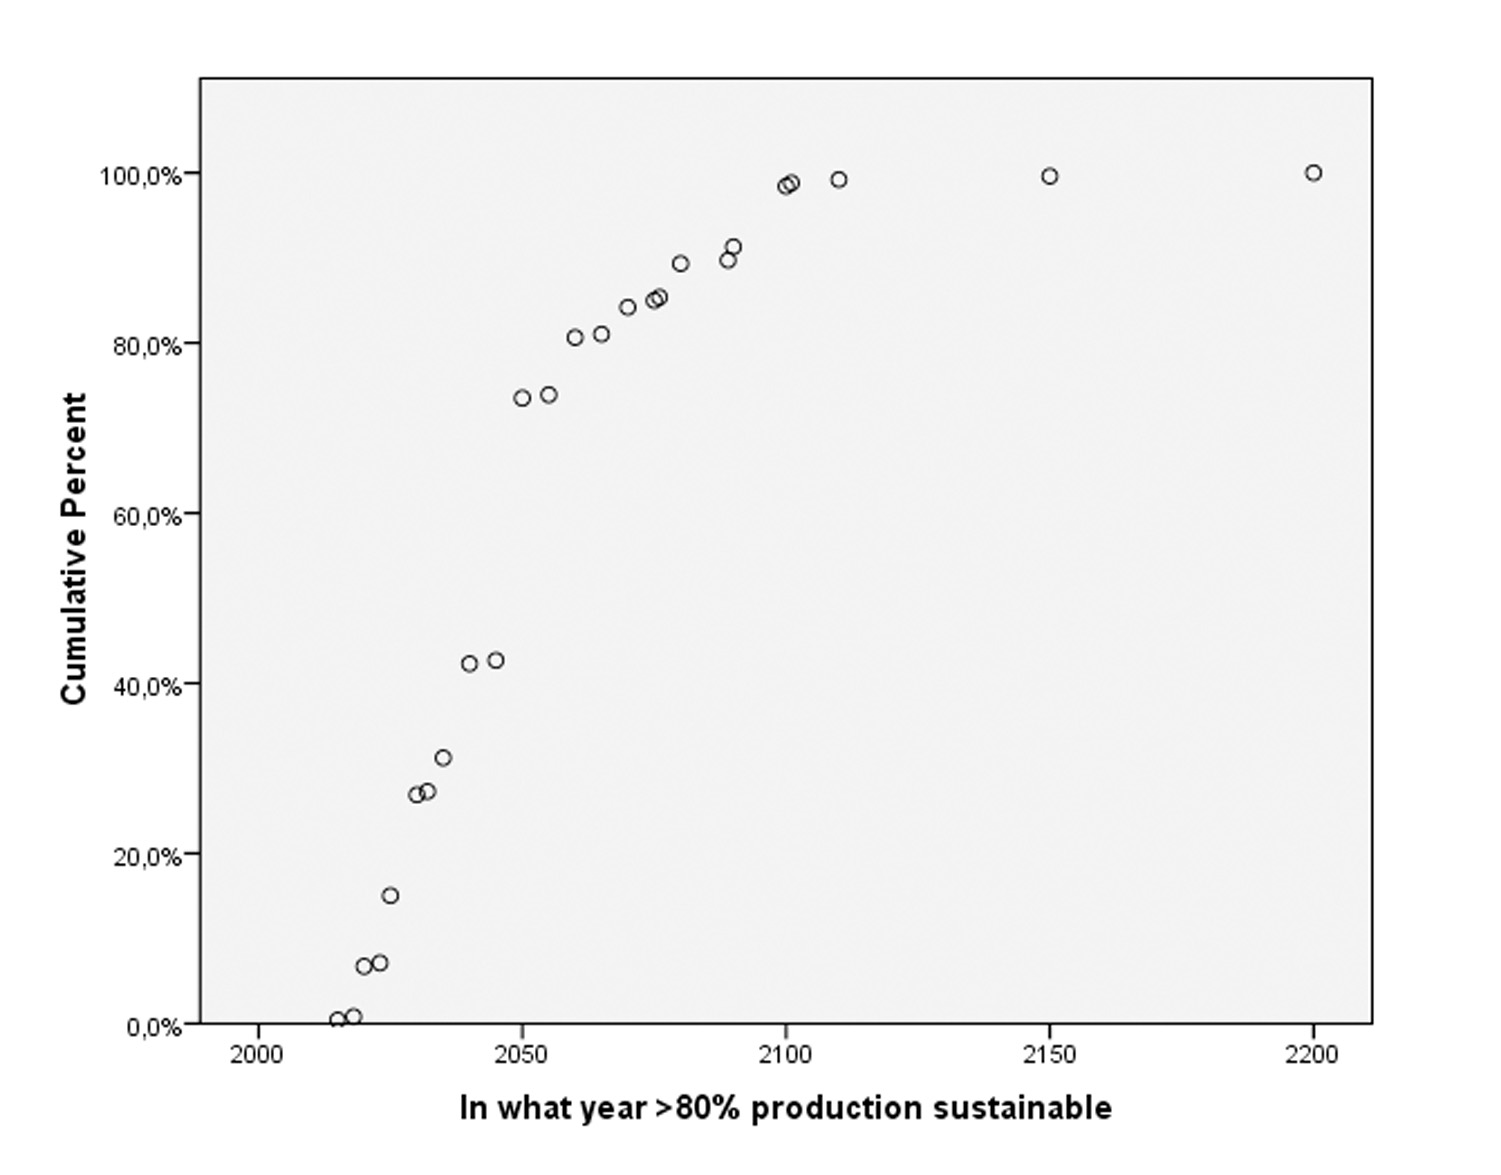
| Figure 11: Expectations. “When do you think more than 80% of the Dutch energy production is sustainable?” |
The final question was an open question and asked the respondents about their expectations concerning sustainable energy production (figure 11). As can be seen, about 75% of the respondents think that more than 80% of the Dutch energy production will be sustainable before 2050. As it appears, the respondents put a lot of trust in scientist.
Quick
Summary
The most important findings of the customer research are;